5 Spatial strategy
National policy
5.1 The NPPF states that strategic policies should set out an overall strategy for the pattern, scale and design quality of places and make sufficient provision for: homes (including affordable housing), employment, retail, leisure and other commercial development (NPPF, paragraph 20).
5.2 To determine the minimum number of homes needed, strategic policies should be informed by a local housing need assessment, conducted using the standard method in national planning practice guidance (NPPF, paragraph 64) to establish a housing requirement figure for the whole area, which shows the extent to which the identified housing need can be met over the plan period (NPPF, paragraph 69).
5.3 Policy-making authorities will also need to prepare a robust evidence base to understand existing business needs (PPG, paragraph 025), using a range of data (PPG, paragraph 027) to quantify land requirements (PPG, paragraph 030), set criteria, and identify strategic sites, for local and inward investment to meet anticipated needs over the plan period (NPPF, paragraph 86b) and address the locations requirements of different sectors (NPPF, paragraph 87).
Evidence base
- Land Availability Assessment (Stage One)(Stage Two in preparation)
- Local Plan Annual Monitoring Reports
- Housing Needs Assessment (to be prepared)
- Economic Needs Assessment (2025)
| Local Plan | Policy reference | Policy summary |
|---|---|---|
| Local Plan (Part One) | STRAT 2 Strategic development |
The spatial strategy as set out in this policy is based on a pattern of development to meet housing and employment needs in locations that maximise the use of existing infrastructure and that are accessible by public transport, focussing on the main urban settlements of: Chester, Ellesmere Port, Northwich and Winsford, and the key service centres of: Cuddington and Sandiway, Farndon, Frodsham, Helsby, Kelsall, Malpas, Neston and Parkgate, Tarporley, Tattenhall and Tarvin. This policy also sets out the settlement hierarchy and provides the context for defining settlement boundaries on the policies map . |
| Local Plan (Part One) | STRAT 8 Rural area |
Supports development in the rural area that serves local needs in the most sustainable and accessible locations, in Key and Local services Centres. The following settlements are defined Key Service Centres: Cuddington and Sandiway, Farndon, Frodsham, Helsby, Kelsall, Malpas, Neston and Parkgate, Tarporley, Tattenhall and Tarvin. |
| Local Plan (Part Two) | R 1 Development in the rural area |
Defines the following settlements as Local Service Centres: Aldford, Antrobus, Ashton Hayes, Childer Thornton, Christleton, Comberbach, Crowton, Delamere, Dodleston, Duddon, Eaton, Eccleston, Elton, Great Barrow, Great Budworth, Guilden Sutton, Higher Wincham, Kingsley, Little Budworth, Mickle Trafford, Moulton, No Mans Heath, Norley, Saughall, Tilston, Utkinton, Waverton, Willaston |
Key issues: Housing needs
- The new Local Plan must plan to meet the government’s housing target (the standard method number) which was revised in December 2024. The Council has no choice in this.
- The figure for Cheshire West and Chester (at 1 April 2025) is a minimum of 1,914 new homes each year, and for a plan covering a 15-year period, this equates to a total figure of 28,710 new homes.
- This housing figure represents a significant increase in the number of new homes that we need to plan for, from the current Local Plan requirement of at least 22,000 new homes over a 20-year period (equating to 1,100 new homes per year).
- The higher figure does not take account of constraints such as designated areas of environmental and heritage value, Green Belt and flood risk. Nor does it consider the impact on infrastructure provision e.g. transport capacity, school places and GP surgeries.
- The government said, in its response to the proposed reforms to the NPPF and other changes to the planning system consultation, that authorities would be able to justify a lower housing requirement than the figure the method sets on the basis of local constraints on land and delivery, such as existing National Park, protected habitats and flood risk areas, but would (as now) have to evidence and justify their approach through local plan consultation and examination.
- The latest housing land monitoring data indicates that we currently have undeveloped planning permissions for almost 6,000 homes.
- The Land Availability Assessment (Stage One) report suggests that there are sites on previously developed land without planning permission, including undeveloped Local Plan allocations, within the main urban areas and Key Service Centres, with a potential capacity of just over 5,000 homes. However, this figure is likely to reduce once a detailed assessment of the constraints, development potential and availability and achievability is carried out in stage two of the process.
- We need to do further technical work to assess the size and type of homes we need and what tenure of homes we should provide, but we are aware of the unaffordability of housing in parts of Cheshire West and how many young people and those on lower incomes struggle to access the housing market.
Key issues: Employment needs
- The Cheshire West and Chester Economic Needs Assessment (2025) looked at a range of methods to derive employment needs (in line with national policy and planning practice guidance), labour demand, labour supply, past take-up and/or future property market requirements.
- The report concludes that the most robust approach is for the authority to plan for around 198 hectares of employment land to meet a range of types and sizes of site over a 20-year period (this equates to 9.9 hectares per year, or 149 hectares over 15 years).
- Industrial, warehousing and distribution land make up a significant proportion of demand. Ellesmere Port followed by Northwich and Winsford are the priority areas for this provision. Large-scale (5 to 25+ hectares) employment sites should make up a minimum of 40% of the future total.
- Office market demand is more difficult to predict, however, it is focused primarily in and around Chester but with the option to be more flexible in some of the ‘office’ parks.
- The report also identifies the sectors of importance to Cheshire West, including specialist sectors, clustering of certain activities and demand for logistics. Major employers in key locations such as Origin Ellesmere Port, and established commercial sites in the Green Belt should continue to be recognised at: Urenco, Capenhurst, and Chester Business Park.
- Established employment areas and land allocations should be identified and protected to meet a range of sizes and types of small-medium business needs, and a limited amount employment should be supported in the rural area to enable small scale expansion of existing employment sites, and new sites within or on the edge of key service centres or areas of new housing growth.
- The latest employment land monitoring data indicates that we currently have undeveloped planning permissions for almost 77 hectares of employment land.
- The Land Availability Assessment stage One report suggests within the urban areas of Chester, Ellesmere Port, Northwich and Winsford there is a potential capacity of 158 hectares in established employment areas. However, this is likely to reduce once a detailed assessment of the constraints, development potential and availability and achievability is carried out in Stage Two, as well as consideration of whether this will deliver the necessary large-scale sites.
Suggested policy approach
5.4 National policy says that the new Local Plan must plan to meet the government’s housing target (the standard method number) which was revised in December 2024. The figure for Cheshire West and Chester is a minimum of 1,914 new homes each year, and for a plan covering a 15-year period, this equates to a total figure of 28,710 new homes.
SS 1
Housing needs
The suggested policy approach is that the Council plans to deliver a minimum of 1,914 new homes each year, over the plan period.
Question SS 1
Is there any reason for the Council not to plan for delivering a minimum of 1,914 new homes each year?
Question SS 2
Do you think the Council should consider a stepped housing requirement that plans for a lower level of housing delivery earlier in the plan period?
5.5 The Economic Needs Assessment (2025) looked at a range of methods to derive employment needs (in line with national policy and planning practice guidance), labour demand, labour supply, past take-up and/or future property market requirements. The report concludes that the most robust approach is for the authority to plan for around 198 hectares of employment land to meet a range of types and sizes of site over a 20-year period (this equates to 9.9 hectares per year, or 149 hectares over 15 years).
SS 2
Employment needs
The suggested policy approach is that the Council plans to deliver a minimum of 9.9 hectares of employment land each year, over the plan period.
Question SS 3
Is there any reason for the Council not to plan for delivering a minimum of 9.9 hectares of employment land each year?
5.6 One of our key objectives is to maximise the opportunities for development and regeneration in the main settlements and towns. Making the best use of these locations not only reuses land but can aid regeneration. It helps ensure development takes place close to existing facilities, services and jobs and is often well connected and accessible. This would update and replace the current Local Plan (Part One) policy STRAT 2.
SS 3
Spatial strategy principles
The spatial strategy will follow the principle of directing new development and allocating land, towards previously developed sites within settlements first, as they are the most sustainable locations with best access to services and facilities.
Redeveloping urban sites comes with a range of choices, especially concerning density and the height of buildings. This approach will require a strong commitment to high quality design to ensure that there is adequate private and shared open space, there are services and access to facilities and issues regarding car parking and travel are resolved.
Urban extensions
Where there are not enough planning permissions and opportunities for redevelopment within urban areas and towns, the approach will be to develop on the edge of existing settlements in locations with the best access to public transport and existing services and infrastructure, as the next best sustainable option.
Depending on the settlement this may require the release of Green Belt land.
Question SS 4
Do you agree with the suggested policy approach towards the spatial strategy principles, as set out in SS 3 ‘Spatial strategy principles’ above? If not please suggest how it could be amended?
5.7 We think that the new Local Plan should retain a settlement hierarchy, but take a more place-based approach with separate policies for each settlement. This would update and replace the current approach which identifies the main settlements, Key Service Centres and Local Service Centres in Local Plan (Part One) policies STRAT 2 and STRAT 8, and Local Plan (Part Two) policies R 1 and DM 1.
SS 4
Settlement hierarchy
The new Local Plan will set out a settlement hierarchy, based on their status and role in providing local infrastructure and services for their relatively larger populations and the surrounding hinterland, for the following places:
- Chester (city)
- Ellesmere Port (main town)
- Northwich (main town)
- Winsford (main town)
- Neston and Parkgate (market town)
- Frodsham (market town)
An individual place-based policy for each settlement will set out the vision, core features, key issues and clear strategy for what development will take place in each settlement.
The following settlements have a level of facilities and services that mean they can meet the day-to-day needs of their residents and those living in surrounding areas: Cuddington and Sandiway; Farndon; Helsby; Kelsall; Malpas; Tarporley; Tarvin; and Tattenhall.
Depending on the spatial strategy option selected (see SS 5 ‘Spatial strategy options’ A-C) for the new Local Plan, these settlements may be amended.
It is recognised that smaller settlements which have a lower level of services and access to public transport could acceptably accommodate infill development and small previously developed sites to meet local needs.
In smaller settlements development should be appropriate in scale and design to conserve that settlements’ character and setting, and should not exceed the capacity of existing services and infrastructure unless the required improvements can be made.
Question SS 5
Do you agree with the suggested policy approach towards the settlement hierarchy, as set out in SS 4 ‘Settlement hierarchy’ above? If not please suggest how it could be amended?
Question SS 6
Should all settlements have some level of development, regardless of whether they are identified in the settlement hierarchy?
Question SS 7
Do you think the new Local Plan should contain place-based policies for smaller settlements such as: Cuddington and Sandiway; Farndon; Helsby; Kelsall; Malpas; Tarporley; Tattenhall; and Tarvin?
Question SS 8
Do you agree that in smaller settlements, the character should be protected and development should not exceed the capacity of existing services and infrastructure?
SS 5
Spatial strategy options
We have devised three growth options for where development could be located, that would mean updating Local Plan (Part One) policy STRAT 2.
To be clear, no decisions have yet been taken about where development might be located. This is a consultation to hear your views about where the new homes and employment land we need to provide for, should be located. Further technical work to assess the suitability and appropriateness of locations and sites will be necessary to determine the most suitable spatial strategy.
The three initial options for growth that we have identified are as follows:
- Option A – Retain the Green Belt
- Option B – Follow current Local Plan level and distribution of development
- Option C – Sustainable transport corridors
These options are set out in more detail below. There is no right or wrong answer in respect of these options. Each option generates different impacts and has a range of pros and cons.
Each of the three alternatives is illustrative only – they indicate the possible pattern and scale of development which might be required and use a diagram base map to give a visual impression of where growth might take place but without identifying specific locations or sites for development.
All options are capable of accommodating at least 29,000 new homes and 149 hectares of employment land.
A place identified on the plan indicates a potential capacity across a range of different sites – and would not be necessarily delivered as a single site. It should not be assumed that places identified on the plan for ‘500-1,500 homes’, for example, are expected to accommodate as much as 1,500 (it could be significantly less).
Where an option indicates that the development of sites outside of a settlement might be necessary (possibly in the Green Belt and/or the countryside), some potential growth areas are identified in section 5.1 Potential growth areas below.
However, it must be noted that the examiner’s reportInspector's Report on Cheshire West and Chester Local Plan (Part One) Strategic Policies.pdf into the Local Plan (Part One) concluded that additional release of Green Belt land around Chester would have a significant adverse effect on the purposes of including land within the Green Belt including to the historic setting, and that the amended Green Belt boundary proposed was capable of enduring and would not need to be altered at the end of the plan period (2030).
It is recognised there may be other options/approaches that could be taken and this consultation provides the opportunity for suggesting amendments to the options proposed or suggesting new options.
Question SS 9
Have circumstances changed since the adoption of the Local Plan (Part One), that would now justify Green Belt release?
Question SS 10
Are there any other considerations that we should take account of in relation to future Green Belt policy?
Question SS 11
Please select the option which is the most appropriate spatial strategy for Cheshire West and Chester:
- Option A - Retain the Green Belt
- Option B - Follow current Local Plan level and distribution of development
- Option C - Sustainable transport corridors
- None of these
Question SS 12
Do you have any alternative spatial strategy options that you would like to suggest?
Question SS 13
Aside from those settlements identified in the spatial strategy options, should new housing or other development be allowed in other settlements? If so, please specify what type of development? For example, infill etc?
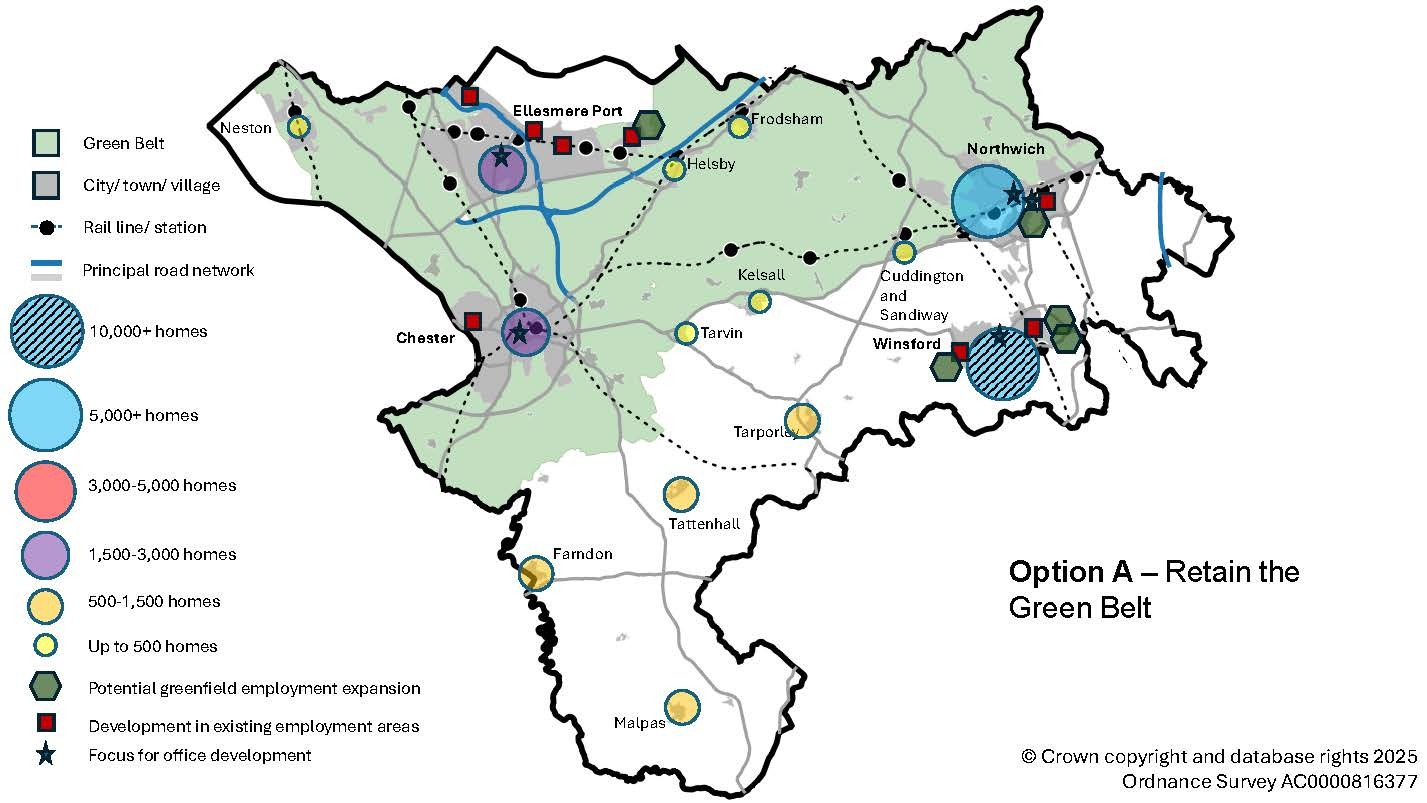
Option A
Retain the Green Belt
Green Belt covers about 42% of Cheshire West across the north of the borough surrounding Chester, Ellesmere Port, Neston and Parkgate, Helsby and Frodsham and the edges of Northwich, Tarvin, Kelsall, and Cuddington and Sandiway. Not all countryside (greenfield land) in the borough is covered by Green Belt as identified on the map accompanying this option.
Government advice is that the Green Belt can only be altered in exceptional circumstances, so it is important to demonstrate that all other reasonable options for meeting needs have been fully explored first, such as using brownfield sites in settlements, increased densities and assessing the potential for growth in neighbouring areas.
This approach therefore assumes that any new development areas are located outside the Green Belt.
For housing development it includes:
- Major development in and to the south of Northwich of just over 5,000 homes.
- Significant urban extensions to the south/west of Winsford of more than 11,000 homes.
- Growth around places that are not located in the Green Belt, such as Tarporley, Tattenhall, Malpas and Farndon.
- More limited development to the south/east of Tarvin, Kelsall and Cuddington and Sandiway on sites that are not in the Green Belt.
For employment development it includes:
- Refurbishment and redevelopment of sites in existing employment areas, retaining key employment locations of: Origin, Ellesmere Port; Winsford Industrial Estate; Woodford Park; Gadbrook Park; Chester West/Sealand Industrial Estate.
- For new large scale industrial/warehousing provision, if this did not deliver enough sites for employment needs, then explore greenfield extensions not located in Green Belt. Indicative locations include: south/ west Gadbrook Park; north/east of Winsford Industrial Estate; west Woodford Park; and east of Protos.
- For office development, focus primarily on town centres or established business parks, including Gadbrook Park.
- Outside of the main settlements and market towns, potential for smaller scale employment or mixed use development, appropriate to the scale and function of the settlement, to meet local employment needs.
Potential growth areas for both housing and employment outside of these settlements are shown in section 5.1 Potential growth areas below.
Question SS 14
Do you feel that Option A is an appropriate spatial strategy for the new Local Plan?
Question SS 15
If you do not feel that Option A is an appropriate spatial strategy option, are there any changes that you could suggest?
Map 5.1 Option A - retain the Green Belt (View full image)
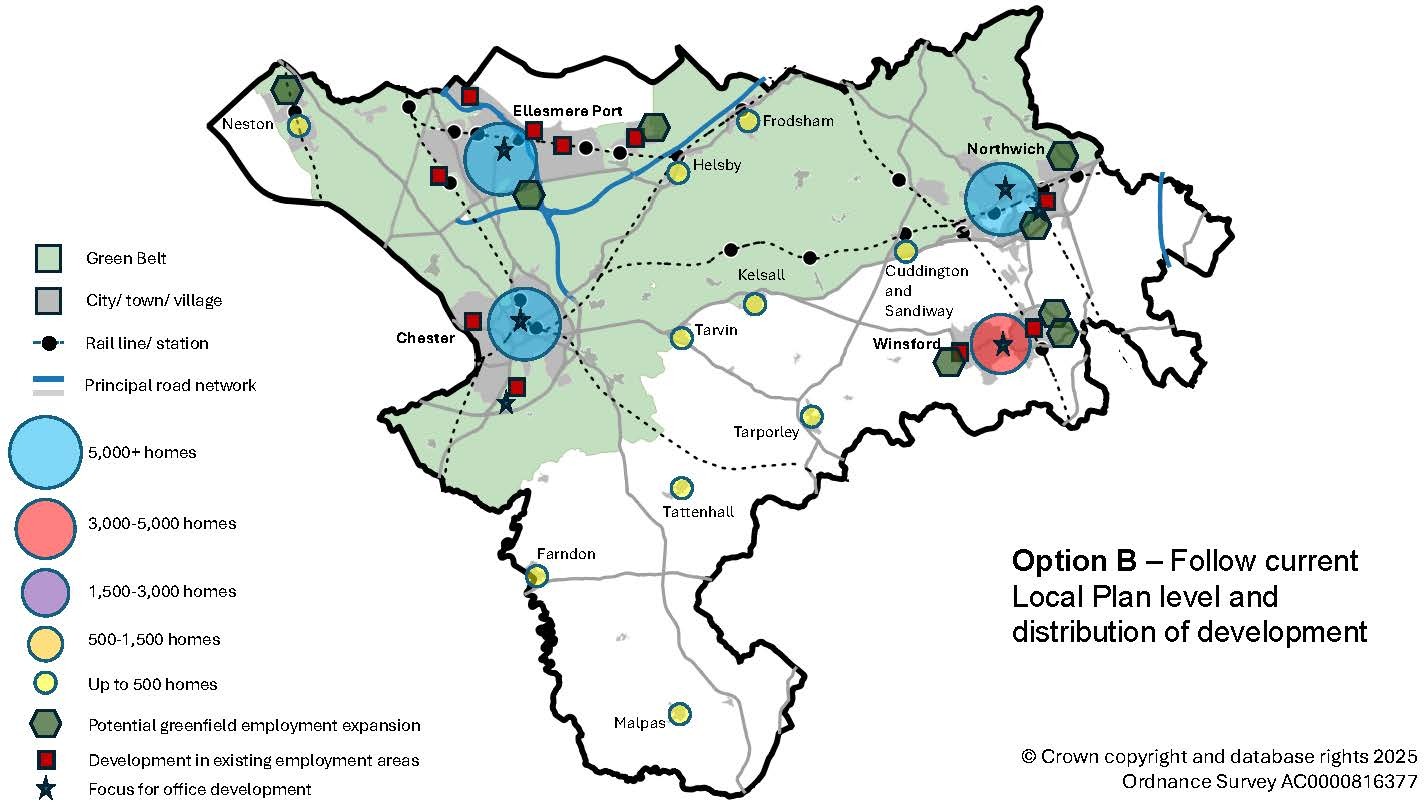
Option B
Follow current Local Plan level and distribution of development
This approach follows the existing Local Plan strategy and settlement hierarchy set out in Local Plan (Part One) Policy STRAT 2, which locates most new development in, or on the edge of the main urban areas, and an appropriate level of new development focused on the smaller settlements which have adequate services and facilities and access to public transport.
A key difference between the Local Plan (Part One) and the new Local Plan is that there is a much more limited supply of previously developed land to accommodate new development, and unlike the last plan, larger areas of Green Belt and/or countryside are likely to be needed.
In developing this option, the government’s new housing target of 28,170 homes has been distributed according to the relative proportions of the existing local plan housing requirement of 22,000 homes as set out in the Local Plan (Part One).
This option would need to ensure that peripheral development has good sustainable connectivity and design relating to existing built form. While a proportion of development can be accommodated within existing settlements, much of the new development under this option would need to be located within the Green Belt and/or countryside.
For housing development it includes:
- Large urban extensions around: Chester; Ellesmere Port; Northwich and Winsford.
- Total Green Belt release of sites to deliver 11,000 homes.
- Relatively limited development in Cuddington and Sandiway; Farndon; Frodsham; Helsby; Kelsall; Malpas; Neston and Parkgate; Tarporley; Tarvin; and Tattenhall of 3,000 homes in total.
- 2,500 homes across the rest of the rural area, including both Green Belt and non-Green Belt land.
For employment development it includes:
- Refurbishment and redevelopment of sites in existing employment areas, retaining key employment locations of: Origin, Ellesmere Port; Winsford Industrial Estate; Woodford Park; Gadbrook Park; Chester West/Sealand Industrial Estate; and commercial sites in the Green Belt at Urenco and Chester Business Park.
- For new large scale industrial/warehousing provision, if this did not deliver enough sites for employment needs, then explore greenfield extensions. Indicative locations include: south/west Gadbrook Park; north/east of Winsford Industrial Estate; west of Woodford Park; and east of Protos;. In the Green Belt, explore the potential around: Wincham; south of Ellesmere Port; and north of Clayhill Industrial Estate, Neston.
- For office development, focus on primarily on town centres or established business parks, including: Chester Business Park and Gadbrook Park.
- Outside of the main settlements and market towns, the potential for smaller scale employment or mixed use development, appropriate to the scale and function of the settlement, to meet local employment needs.
Potential growth areas for both housing and employment outside of these settlements are shown in section 5.1 Potential growth areas below.
Question SS 16
Do you feel that Option B is an appropriate spatial strategy for the new Local Plan?
Question SS 17
If you do not feel that Option B is an appropriate spatial strategy option, are there any changes that you could suggest?
Map 5.2 Option B - follow current Local Plan level and distribution of development (View full image)
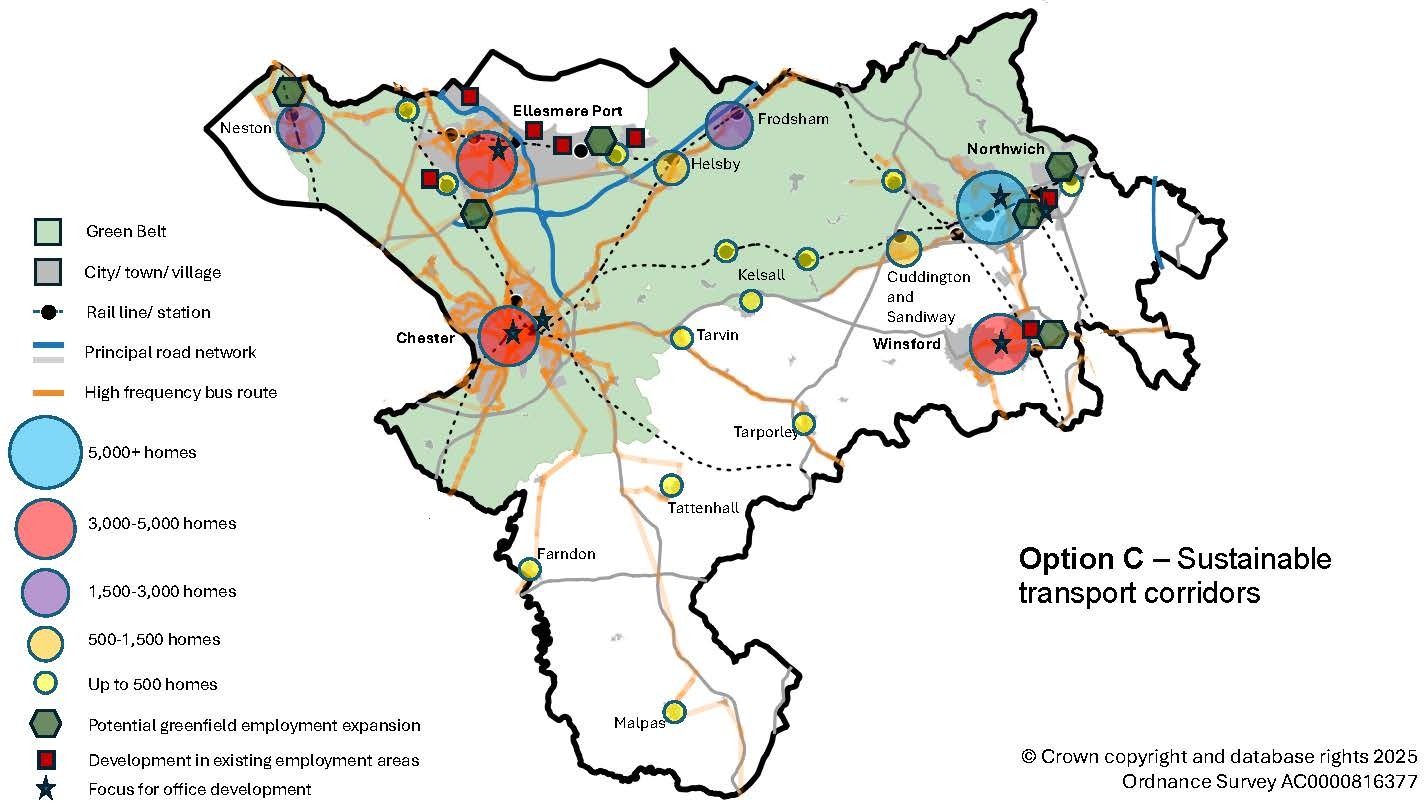
Option C
Sustainable transport corridors
This option would see new homes focused in and around settlements on the railway network, and on main bus route corridors (based on those routes with a bus service frequency of at least one per hour). Focusing development in locations currently well-served by trains and buses would maximise opportunities for sustainable travel choices and could support future improvements to services, frequency and hours.
In this scenario there would also be brownfield opportunities at all main urban areas including locations where transport hubs could be improved such as at stations and smaller settlements with stations and/or bus connectivity, including long term aspirations for a new rail station at Gadbrook Park.
This approach could have a greater impact on the Green Belt if multiple developments took place along corridors potentially adding to the impression of urban sprawl and the merging of settlements.
For housing development it includes:
- A more distributed pattern of development.
- More modest urban extensions around: Chester; Ellesmere Port; Northwich; and Winsford
- Smaller settlements with a rail station, such as: Cuddington and Sandiway; Helsby; Frodsham; and Neston and Parkgate would take a bigger role in accommodating development.
- Total Green Belt release of sites to deliver more than 12,000 homes.
- Potential for further development in the rural area and in places along bus corridors including: Farndon; Malpas; Tarporley; Tarvin; and Tattenhall.
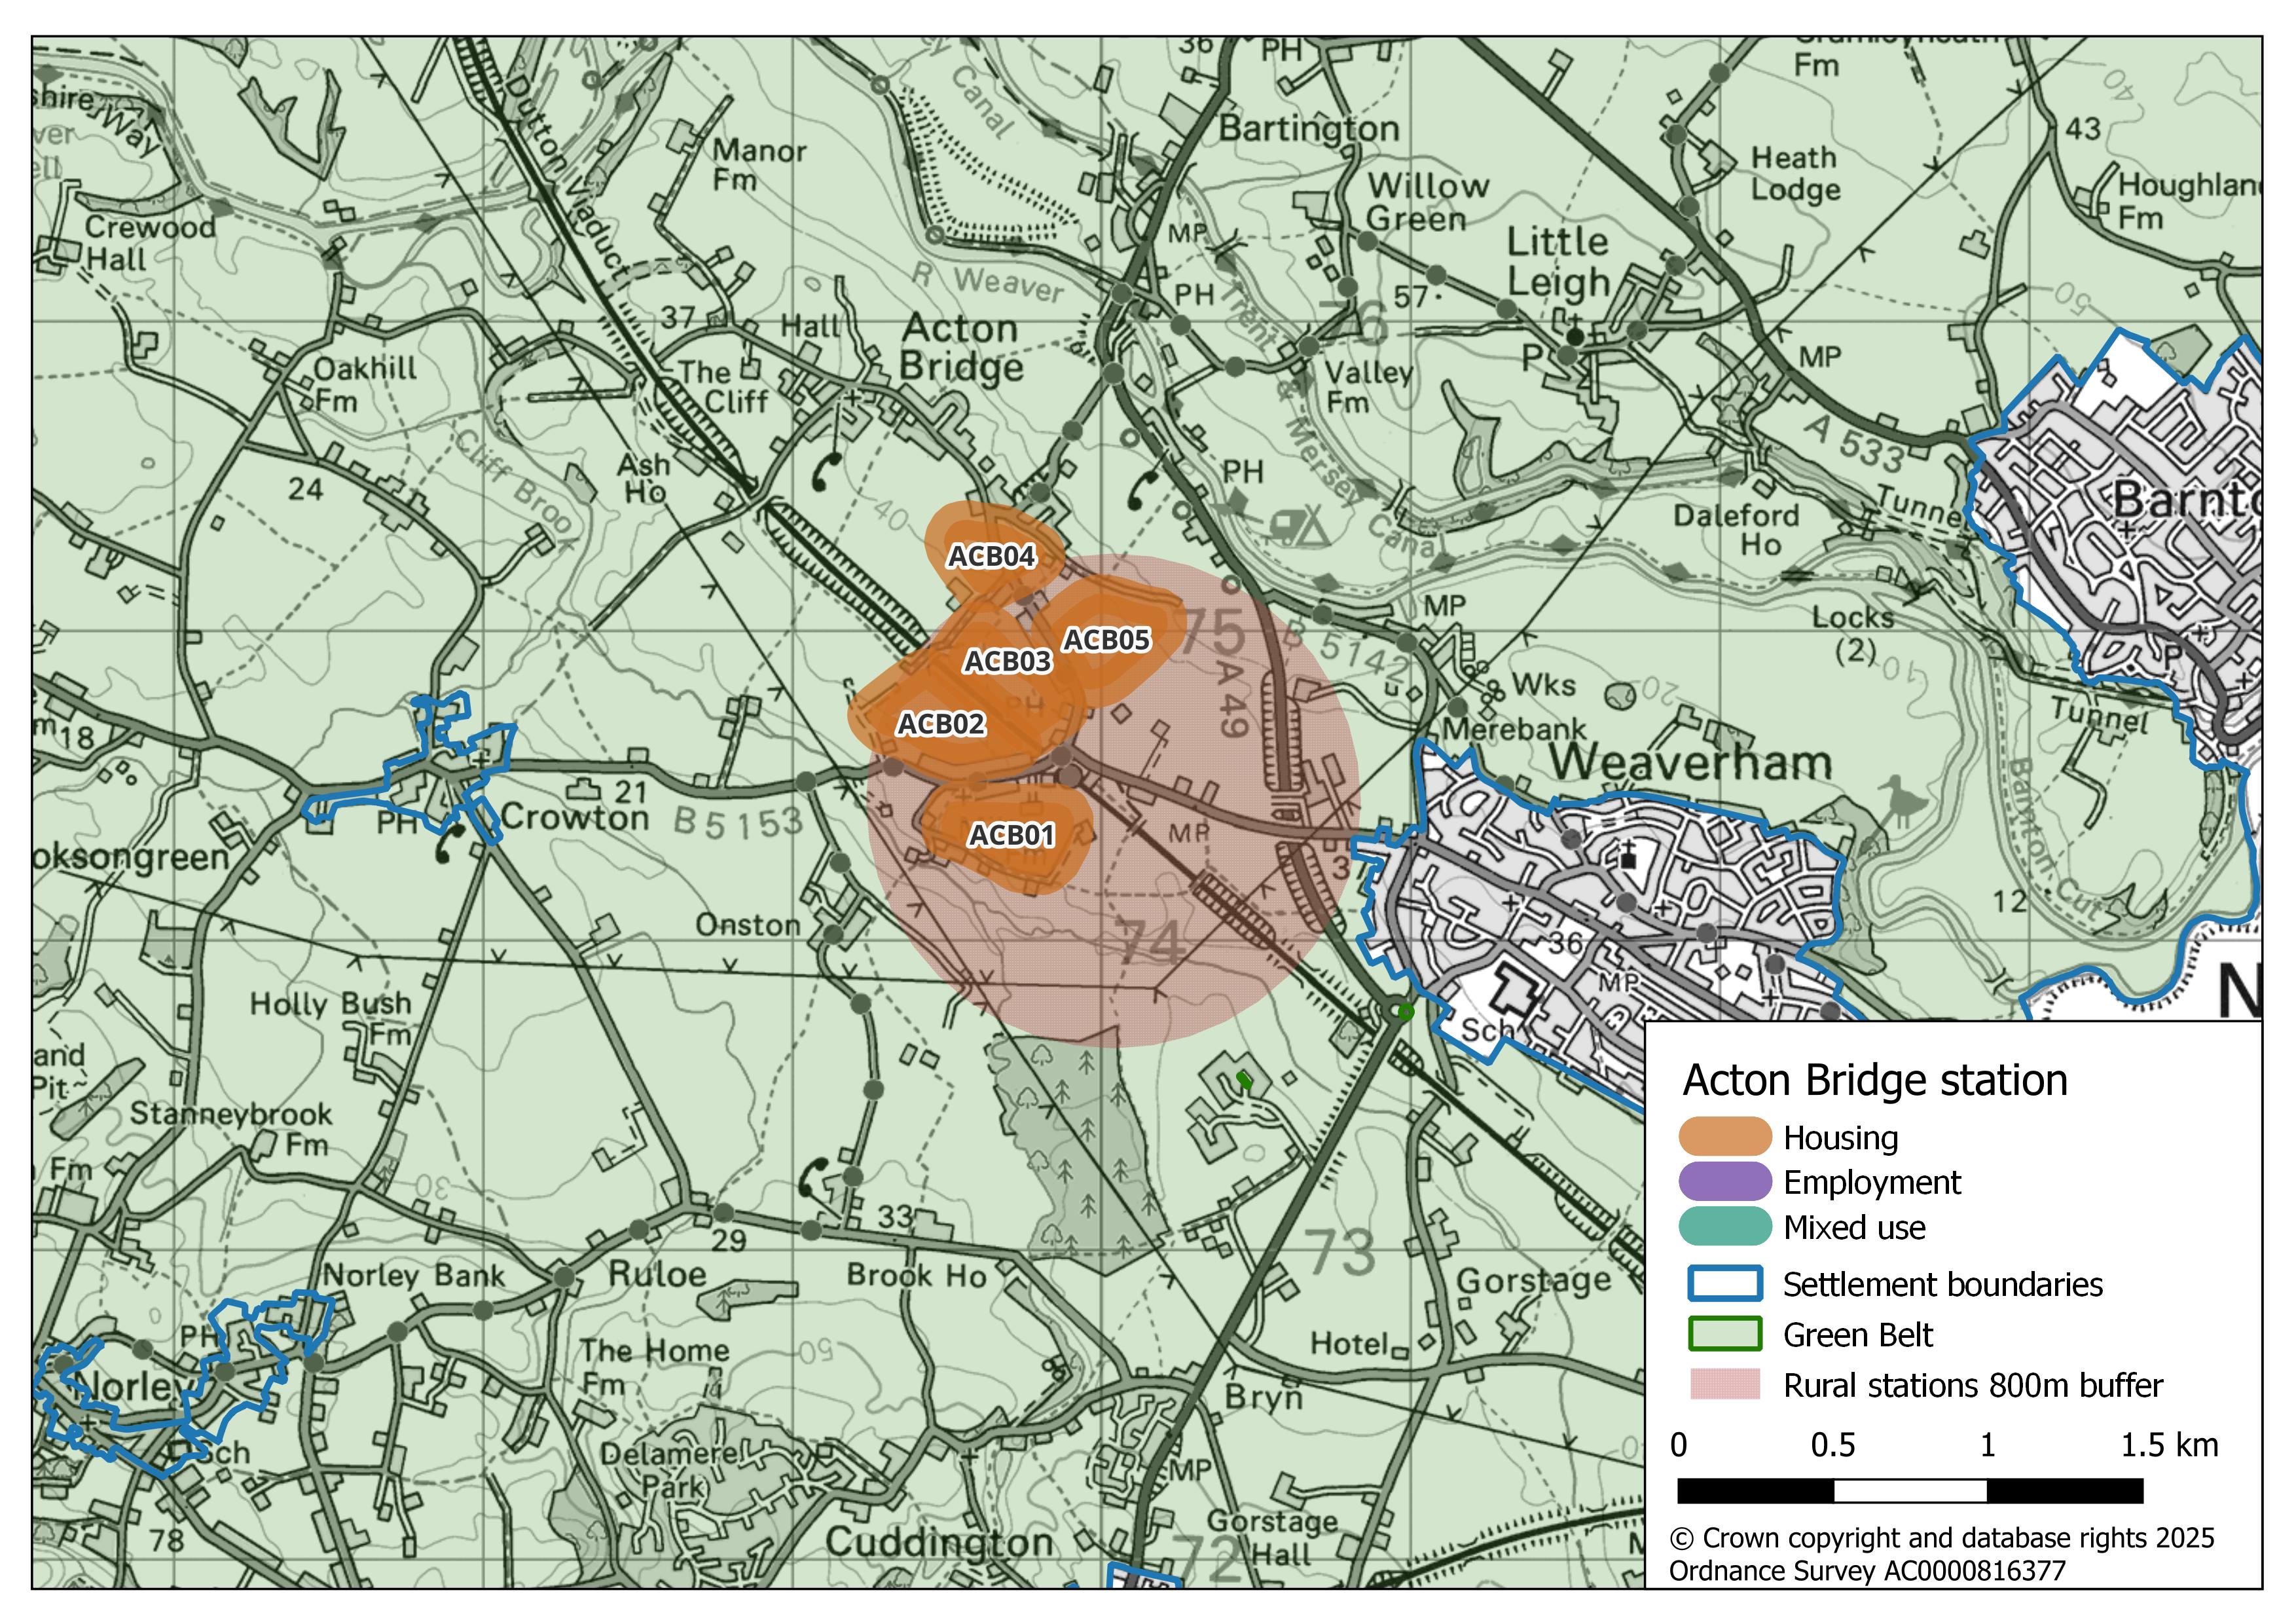
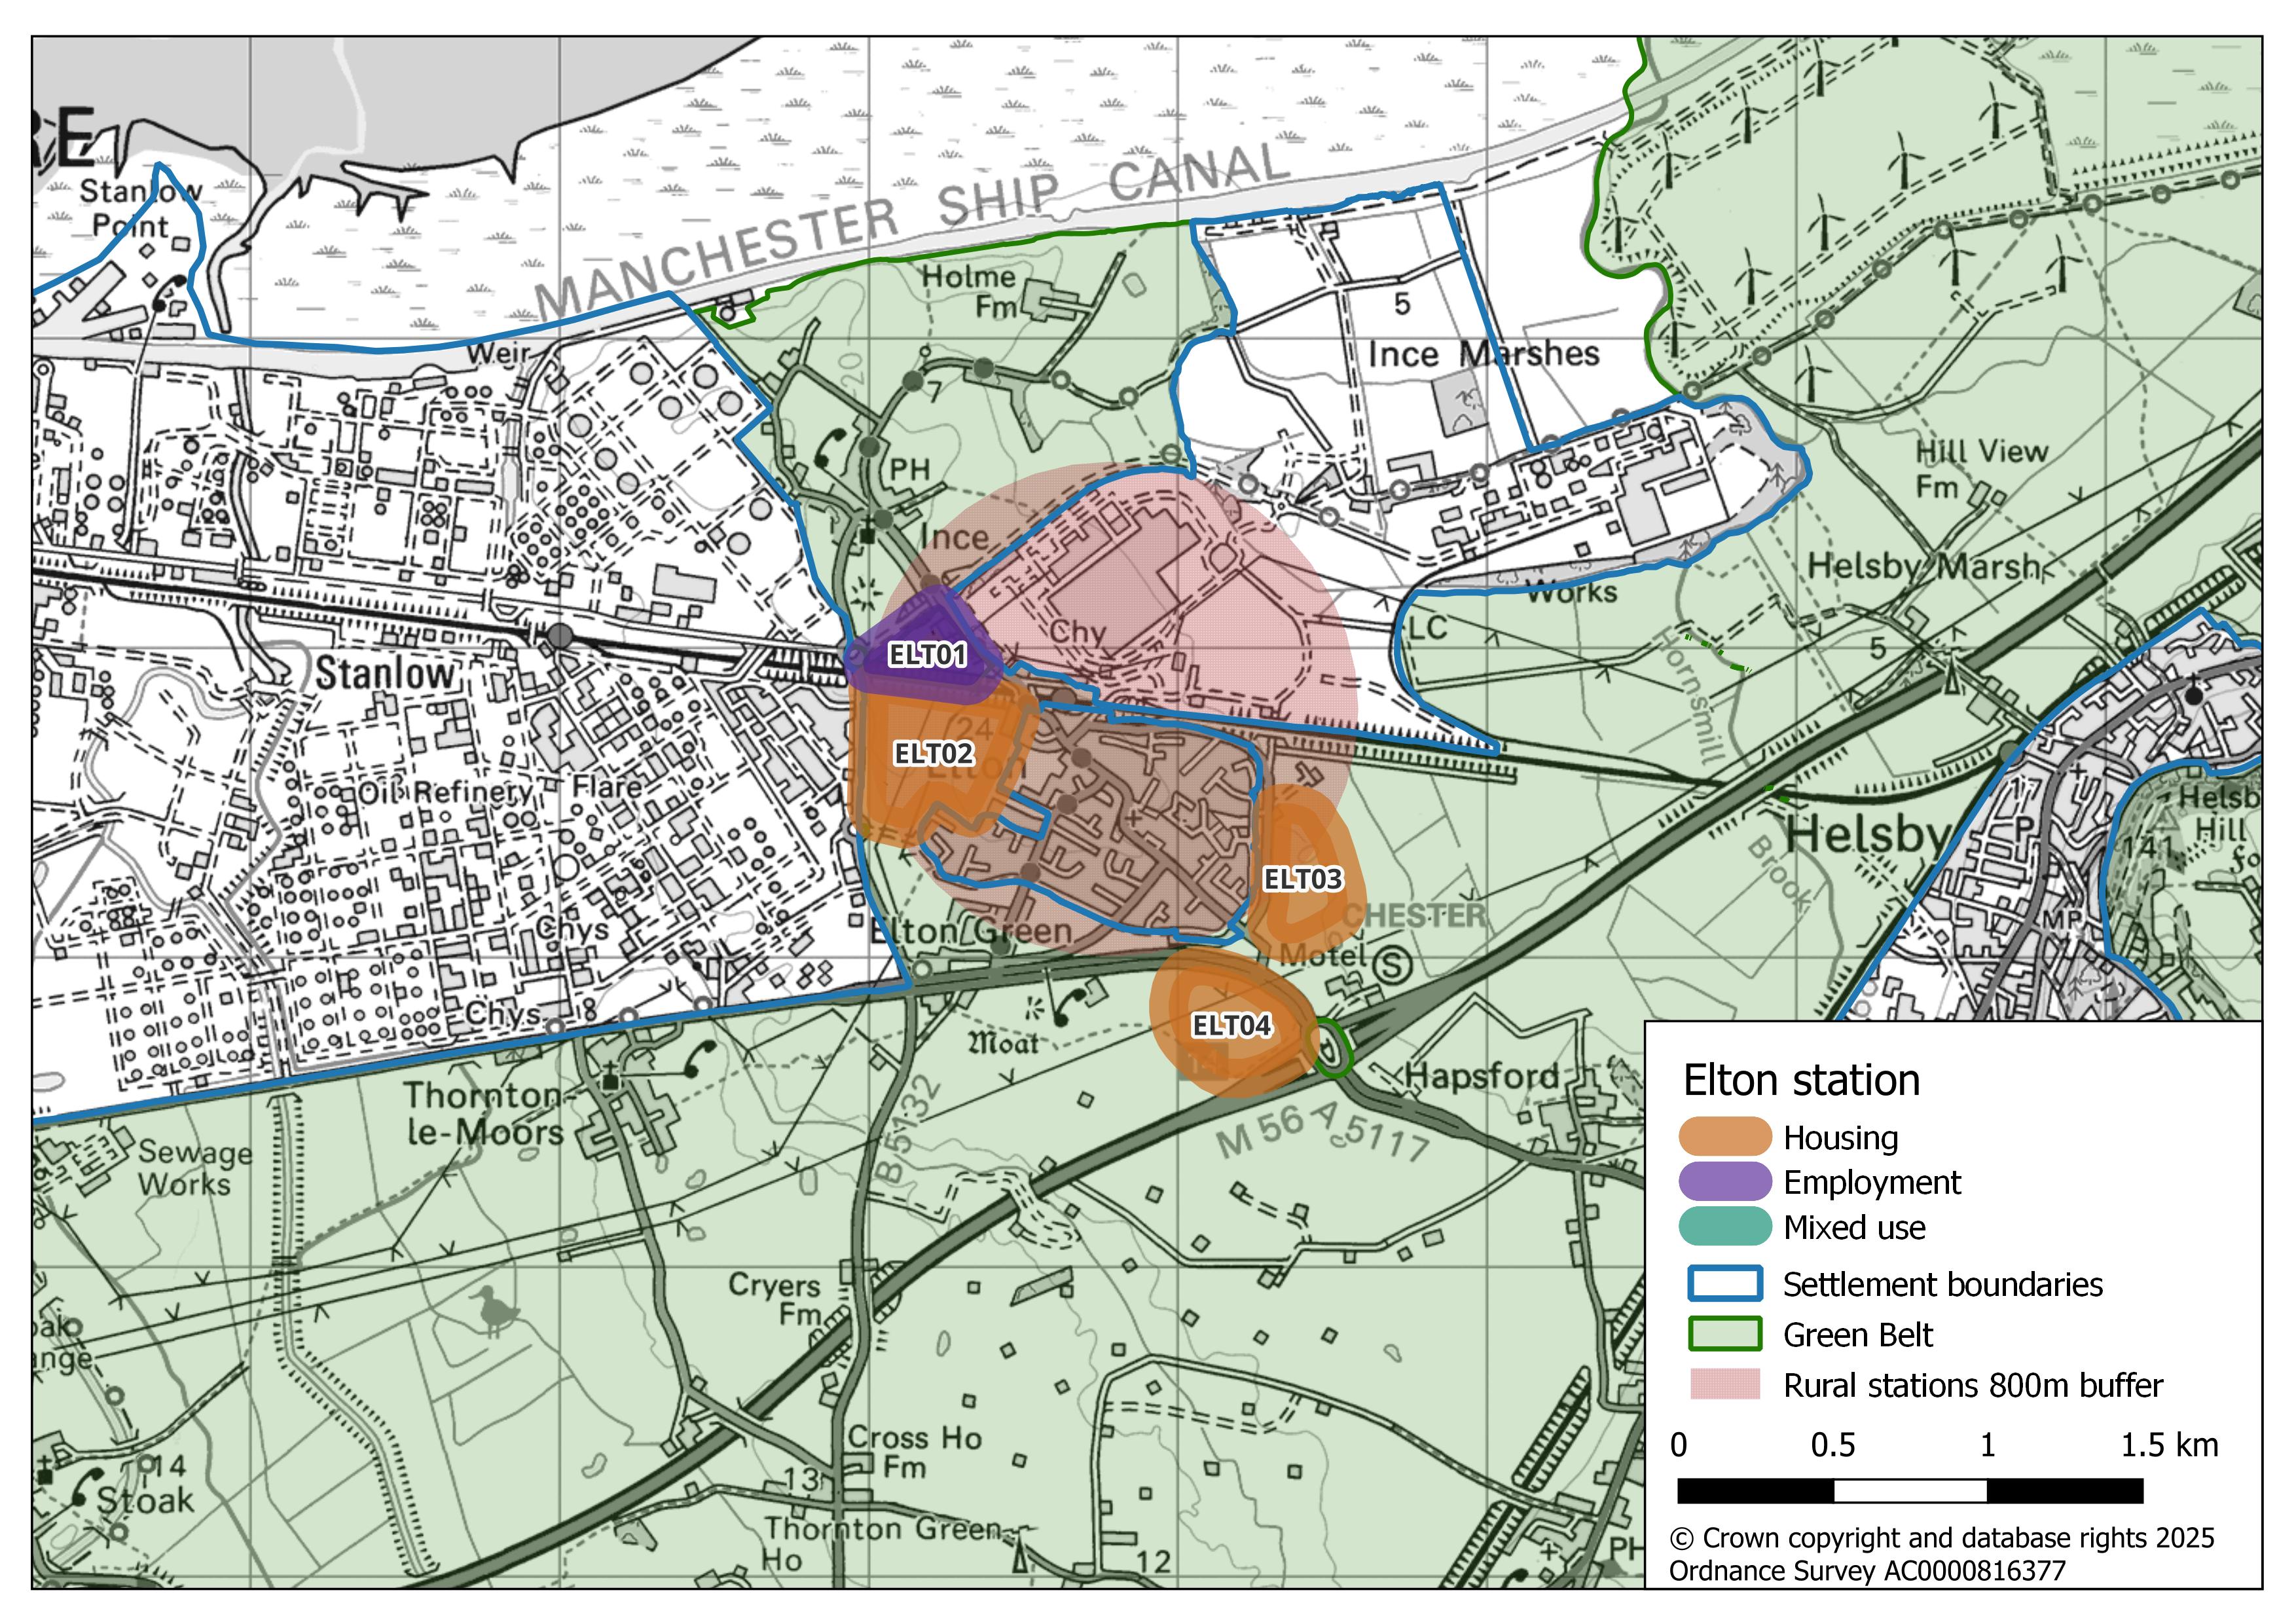
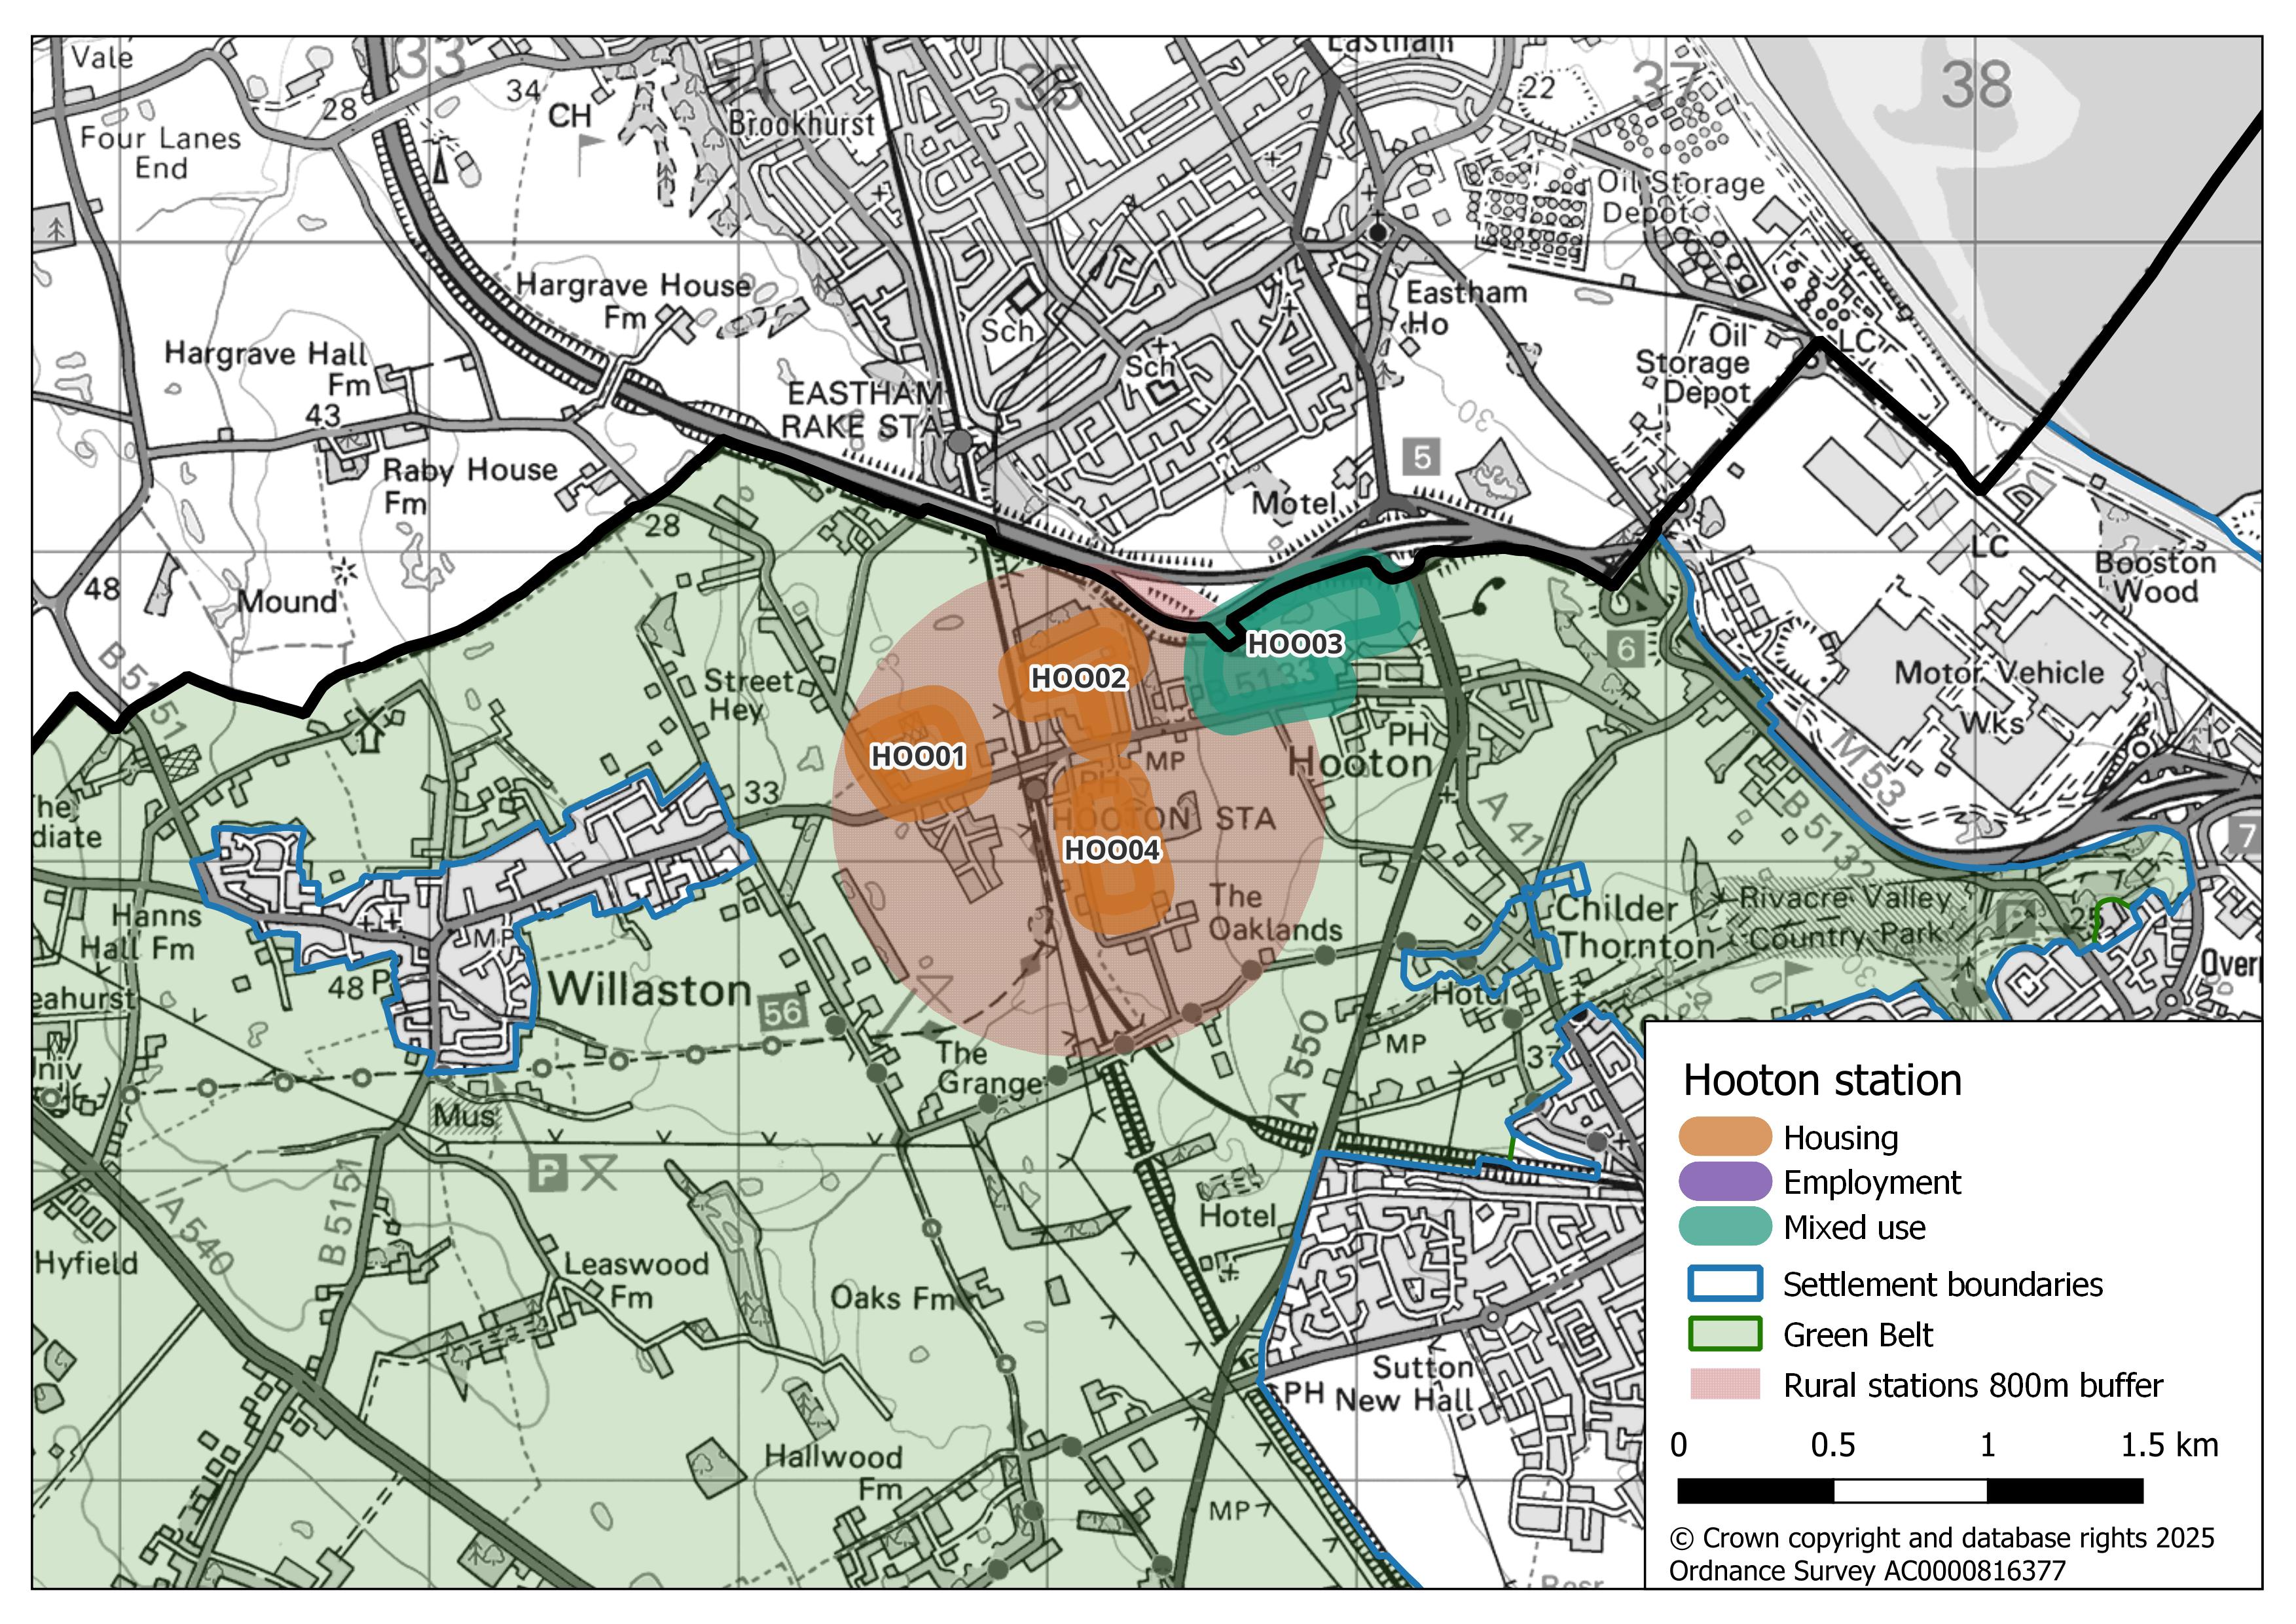
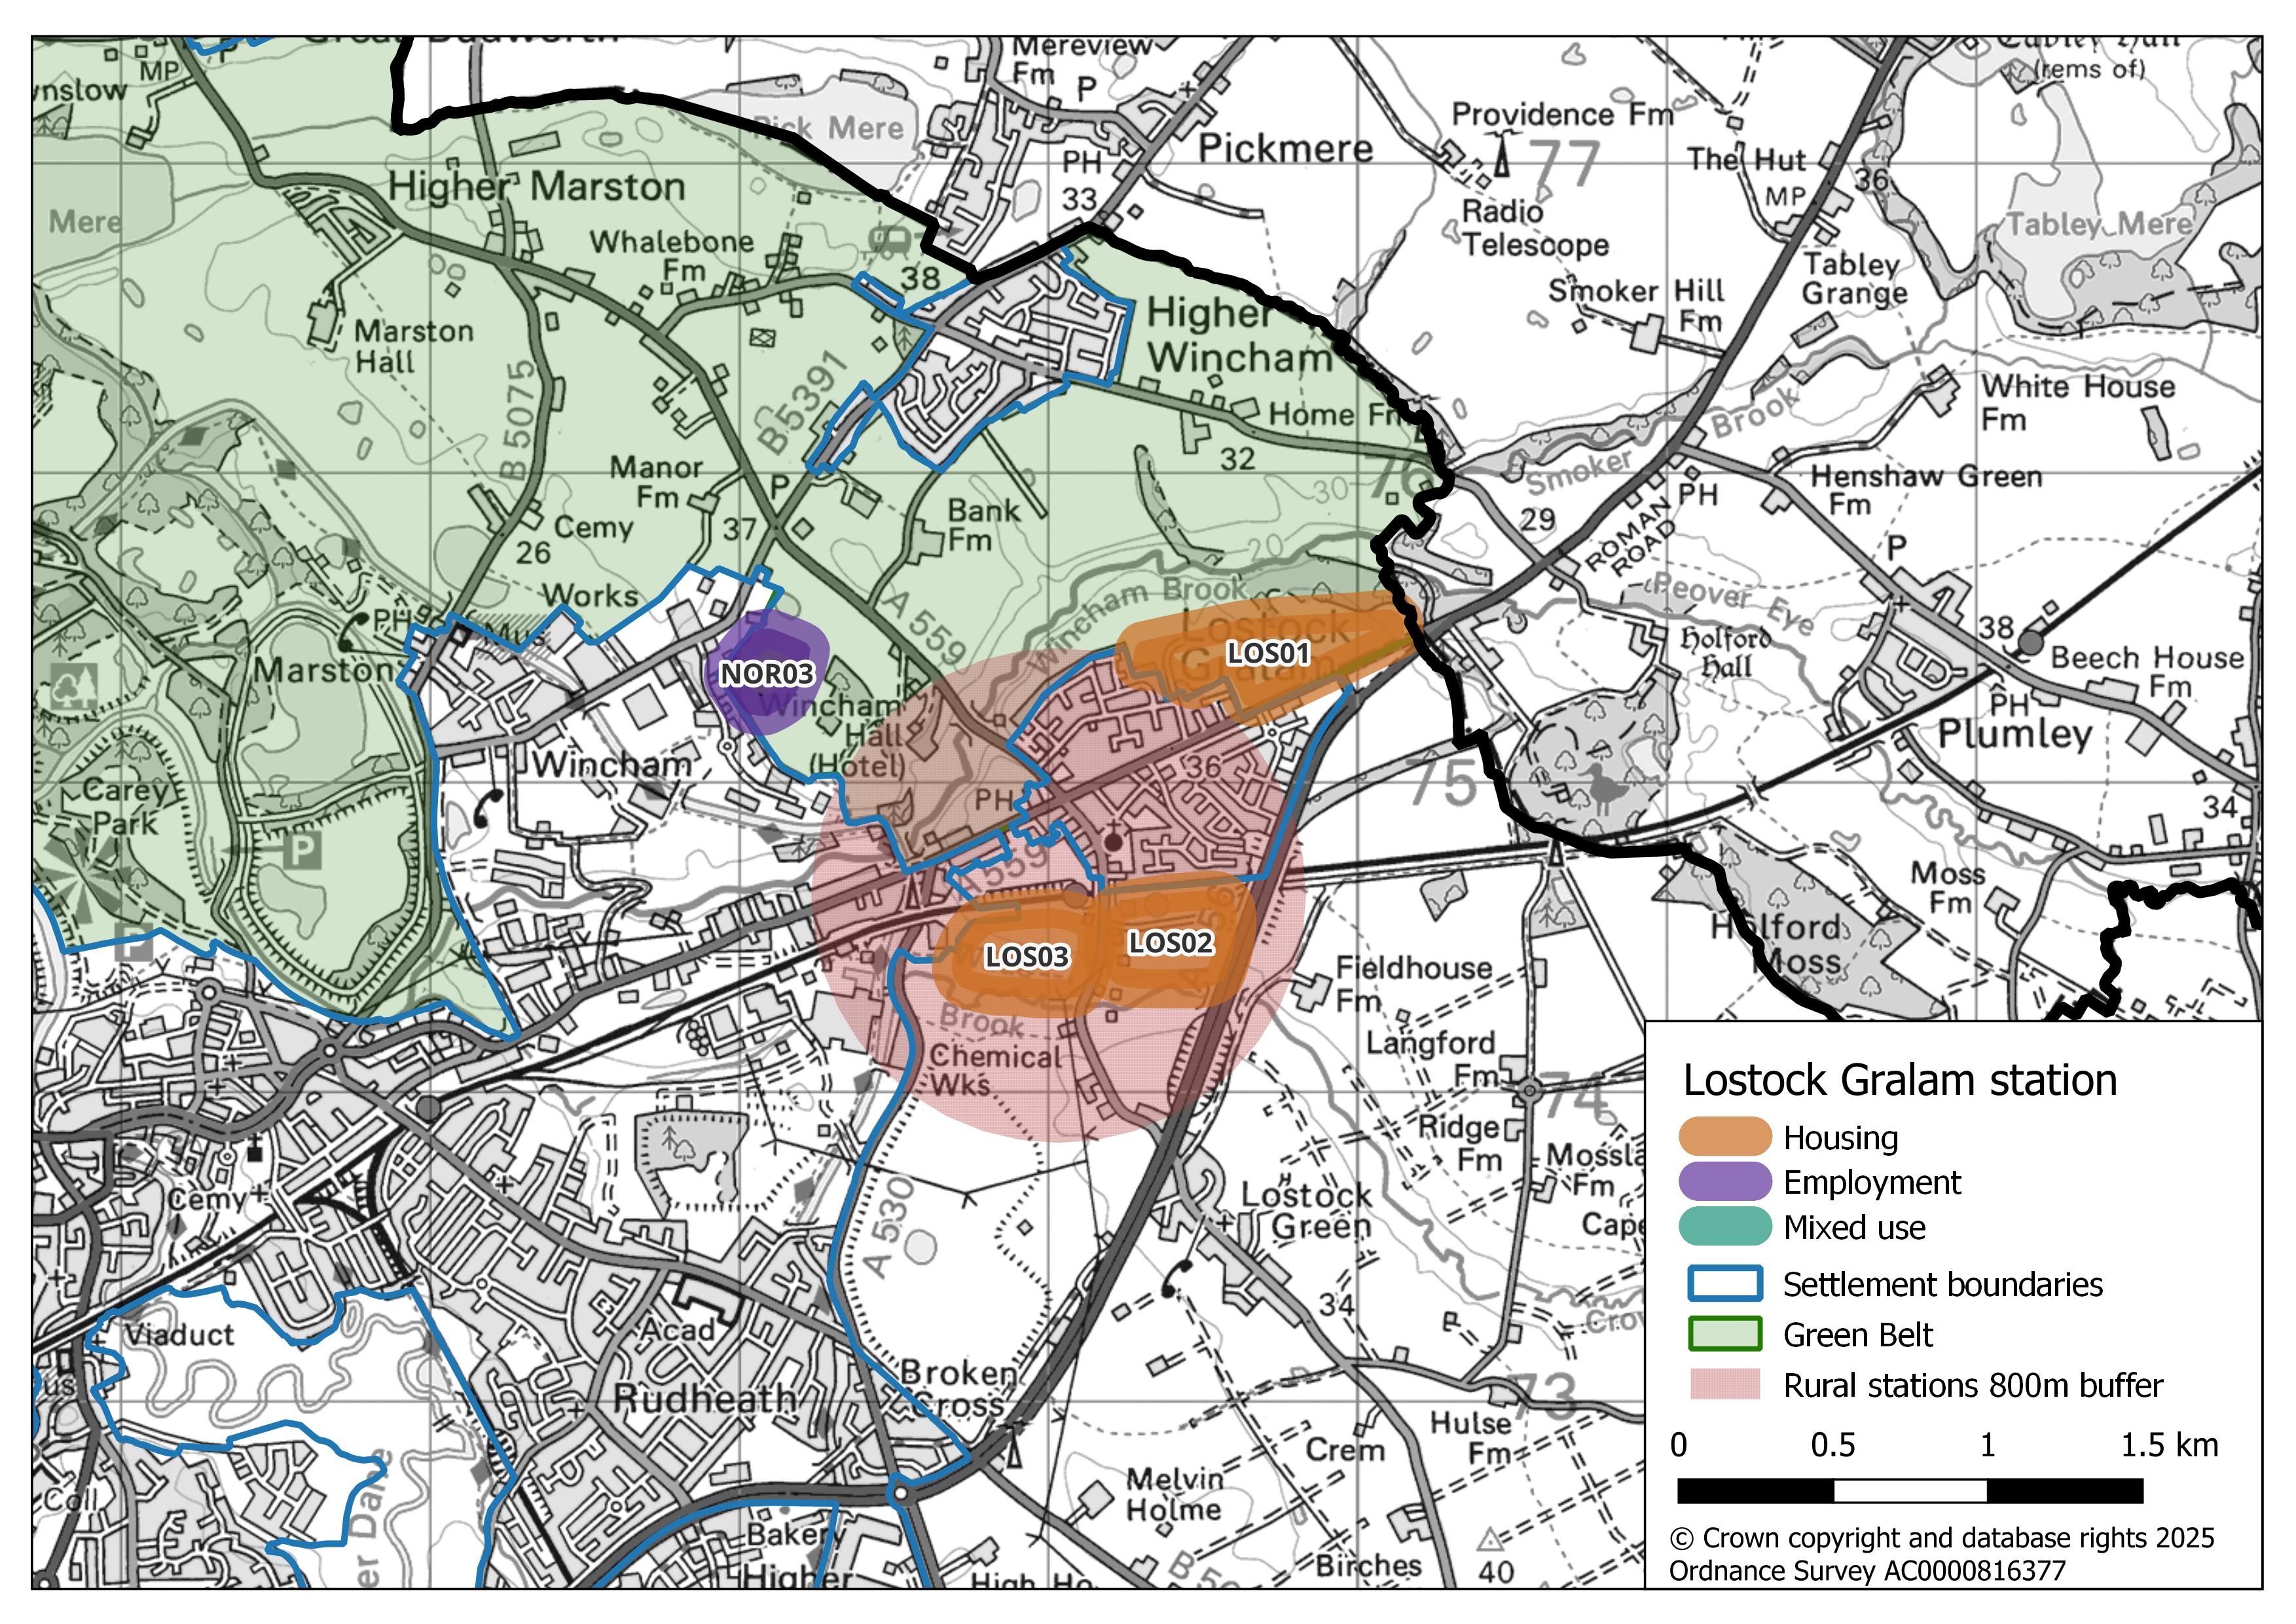
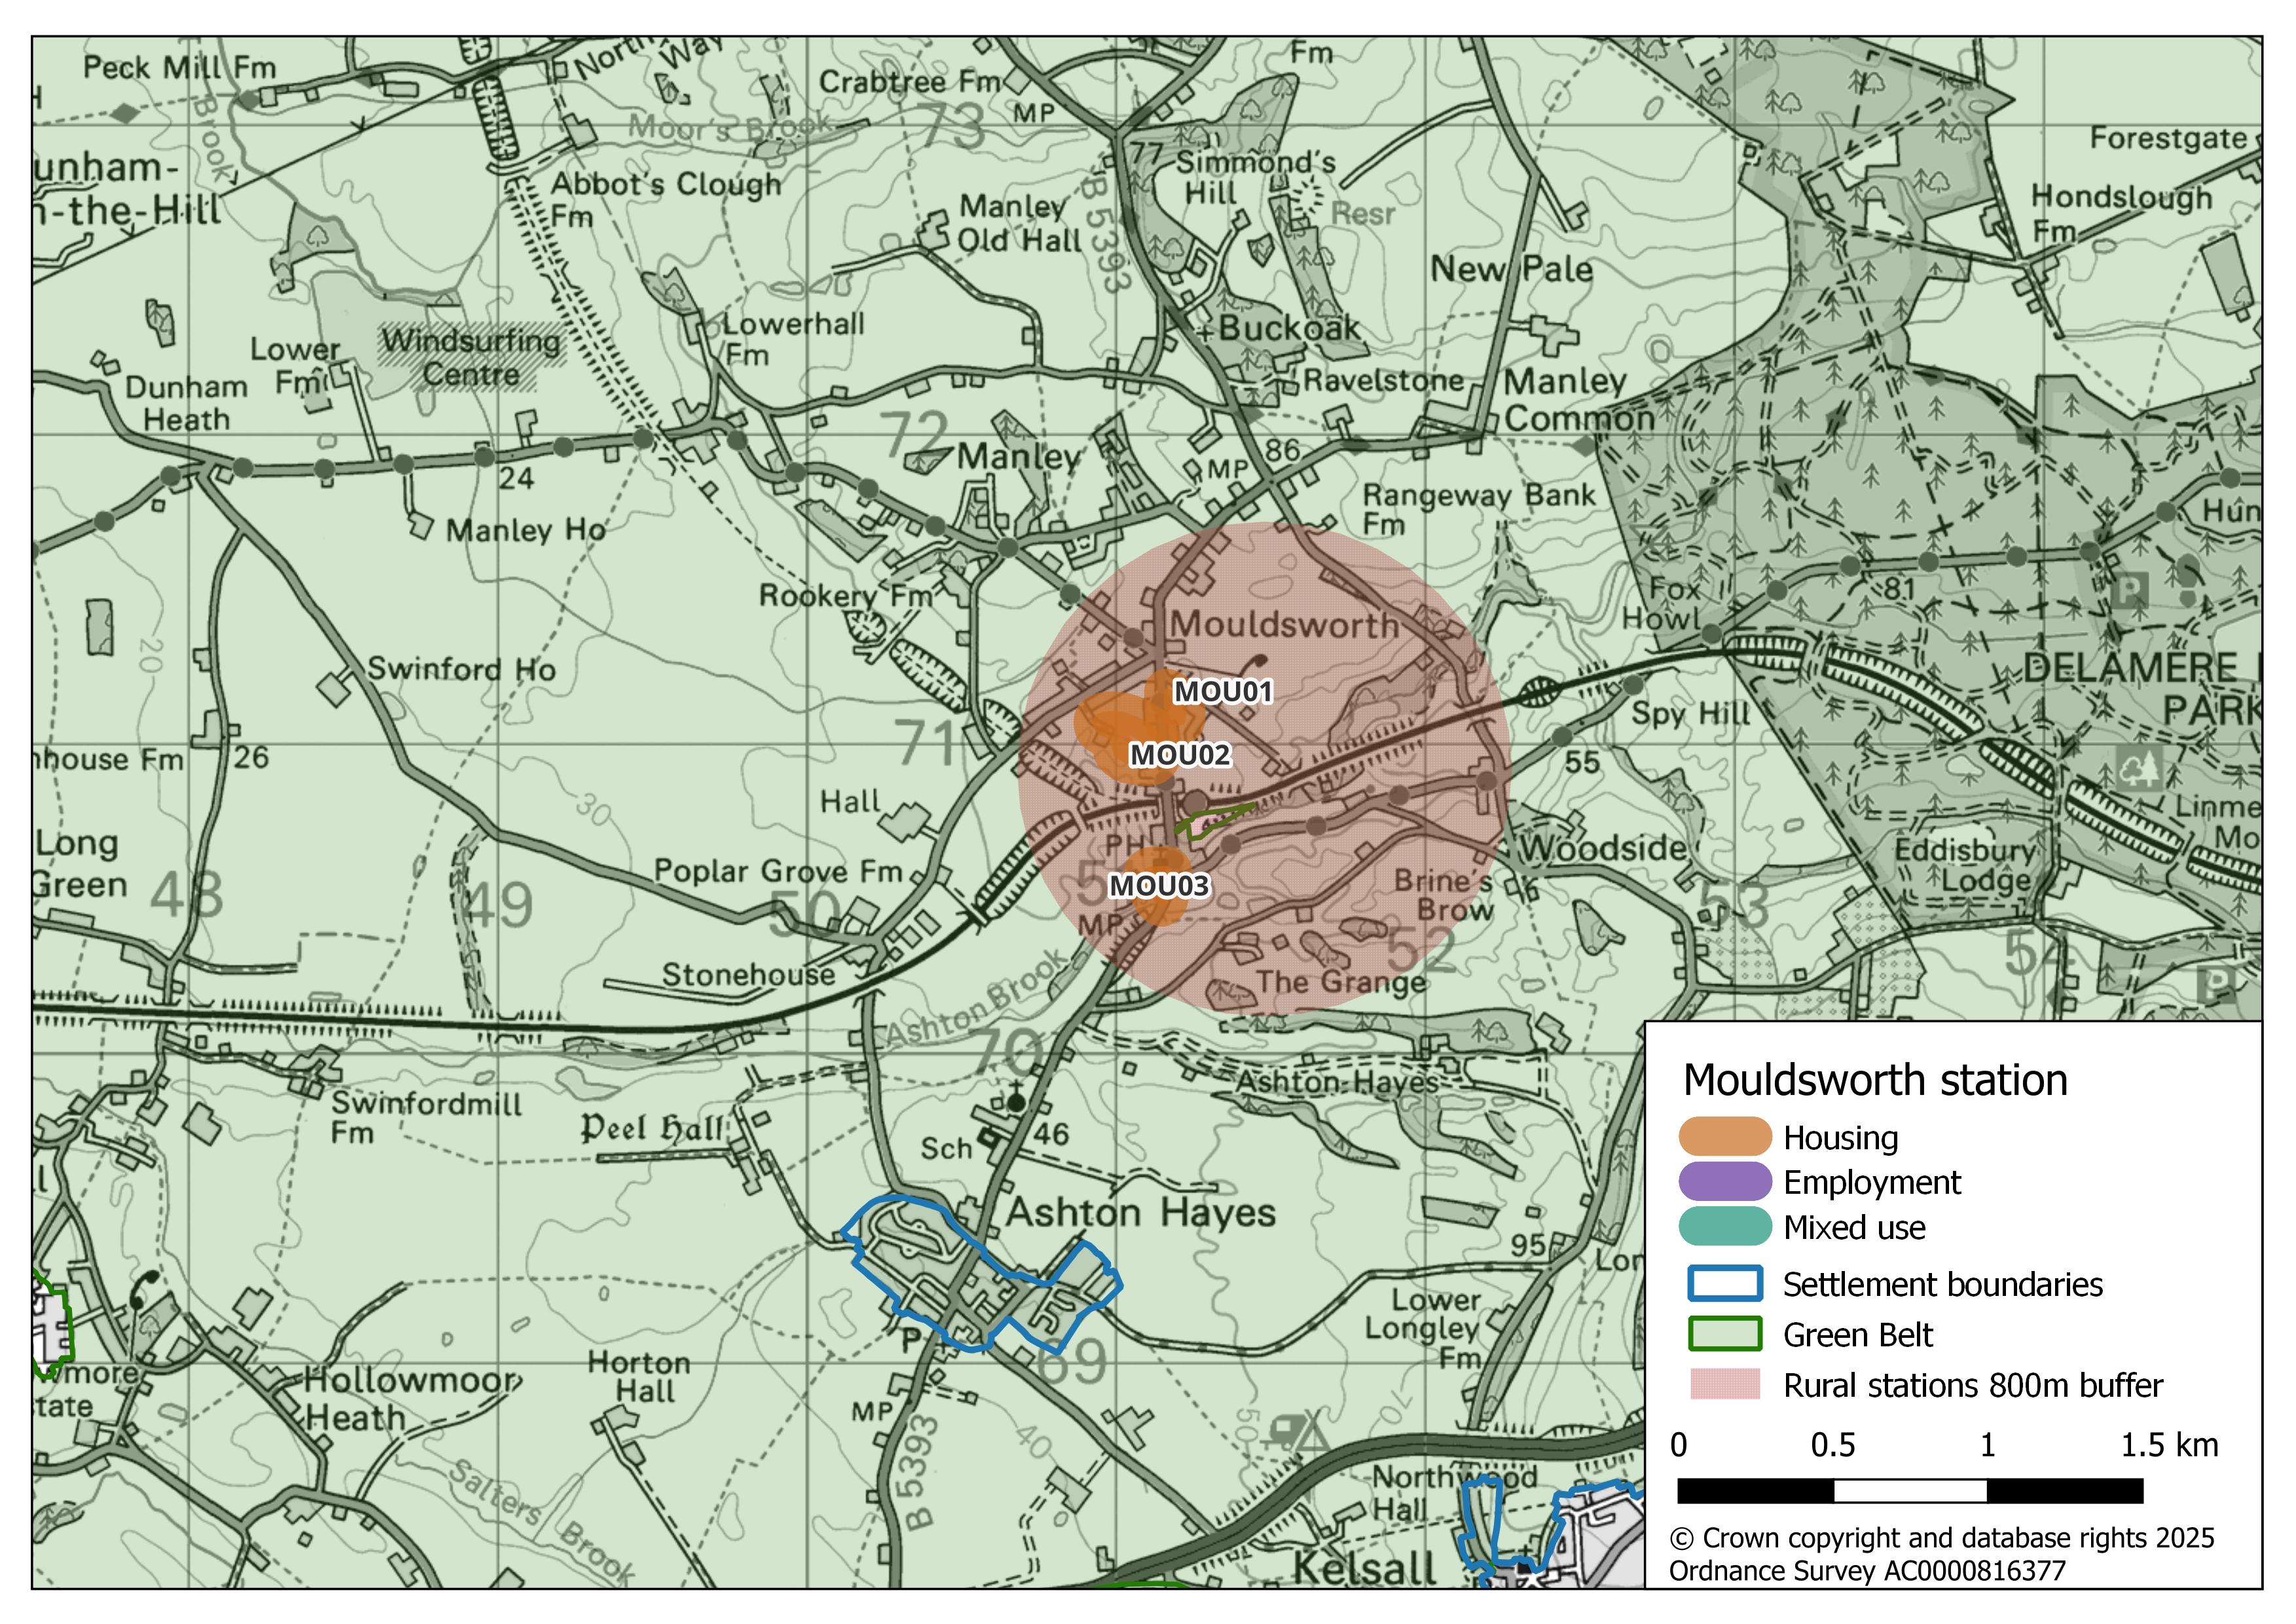
- Potential for an enhanced role around rural rail stations including: Acton Bridge; Capenhurst; Delamere; Elton; Hooton; Lostock Gralam; and Mouldsworth.
For employment development it includes;
- Refurbishment and redevelopment of sites in existing employment areas, retaining key employment locations of: Origin, Ellesmere Port; Winsford Industrial Estate; Gadbrook Park; and commercial sites in the Green Belt at Urenco, Capenhurst.
- For new large scale industrial/warehousing provision, if this did not deliver enough sites for employment needs, then explore greenfield extensions, particularly with multi-modal opportunities (port/rail) for freight, or locations close to existing or planned railway stations for passengers. Indicative locations include: Origin eastern employment area; south/west Gadbrook Park incorporating a new railway station; Wincham, Lostock Gralam; south/east of Winsford Industrial Estate; and north of Clayhill Industrial Estate, Neston.
- For office development, focus primarily on town centres or established business parks. This could include well connected sites such as: Chester Business Quarter; and Gadbrook Park subject to a new railway station south/west of Gadbrook Park.
- Outside of the main settlements and market towns, the potential for smaller scale employment or mixed use development close to local railway stations, appropriate to the scale and function of the settlement, to meet local employment needs.
Potential growth areas for both housing and employment outside of these settlements are shown in section 5.1 Potential growth areas below.
Question SS 18
Do you feel that Option C is an appropriate spatial strategy for the new Local Plan?
Question SS 19
If you do not feel that Option C is an appropriate spatial strategy option, are there any changes that you could suggest?
Map 5.3 Option C - sustainable transport corridors (View full image)
5.1 Potential growth areas
Potential growth areas
5.8 Under all of the SS 5 ‘Spatial strategy options’ set out above, it may be necessary to identify new areas or broad locations for development if not enough land can be identified within settlements. These may be located in the Green Belt and/or countryside.
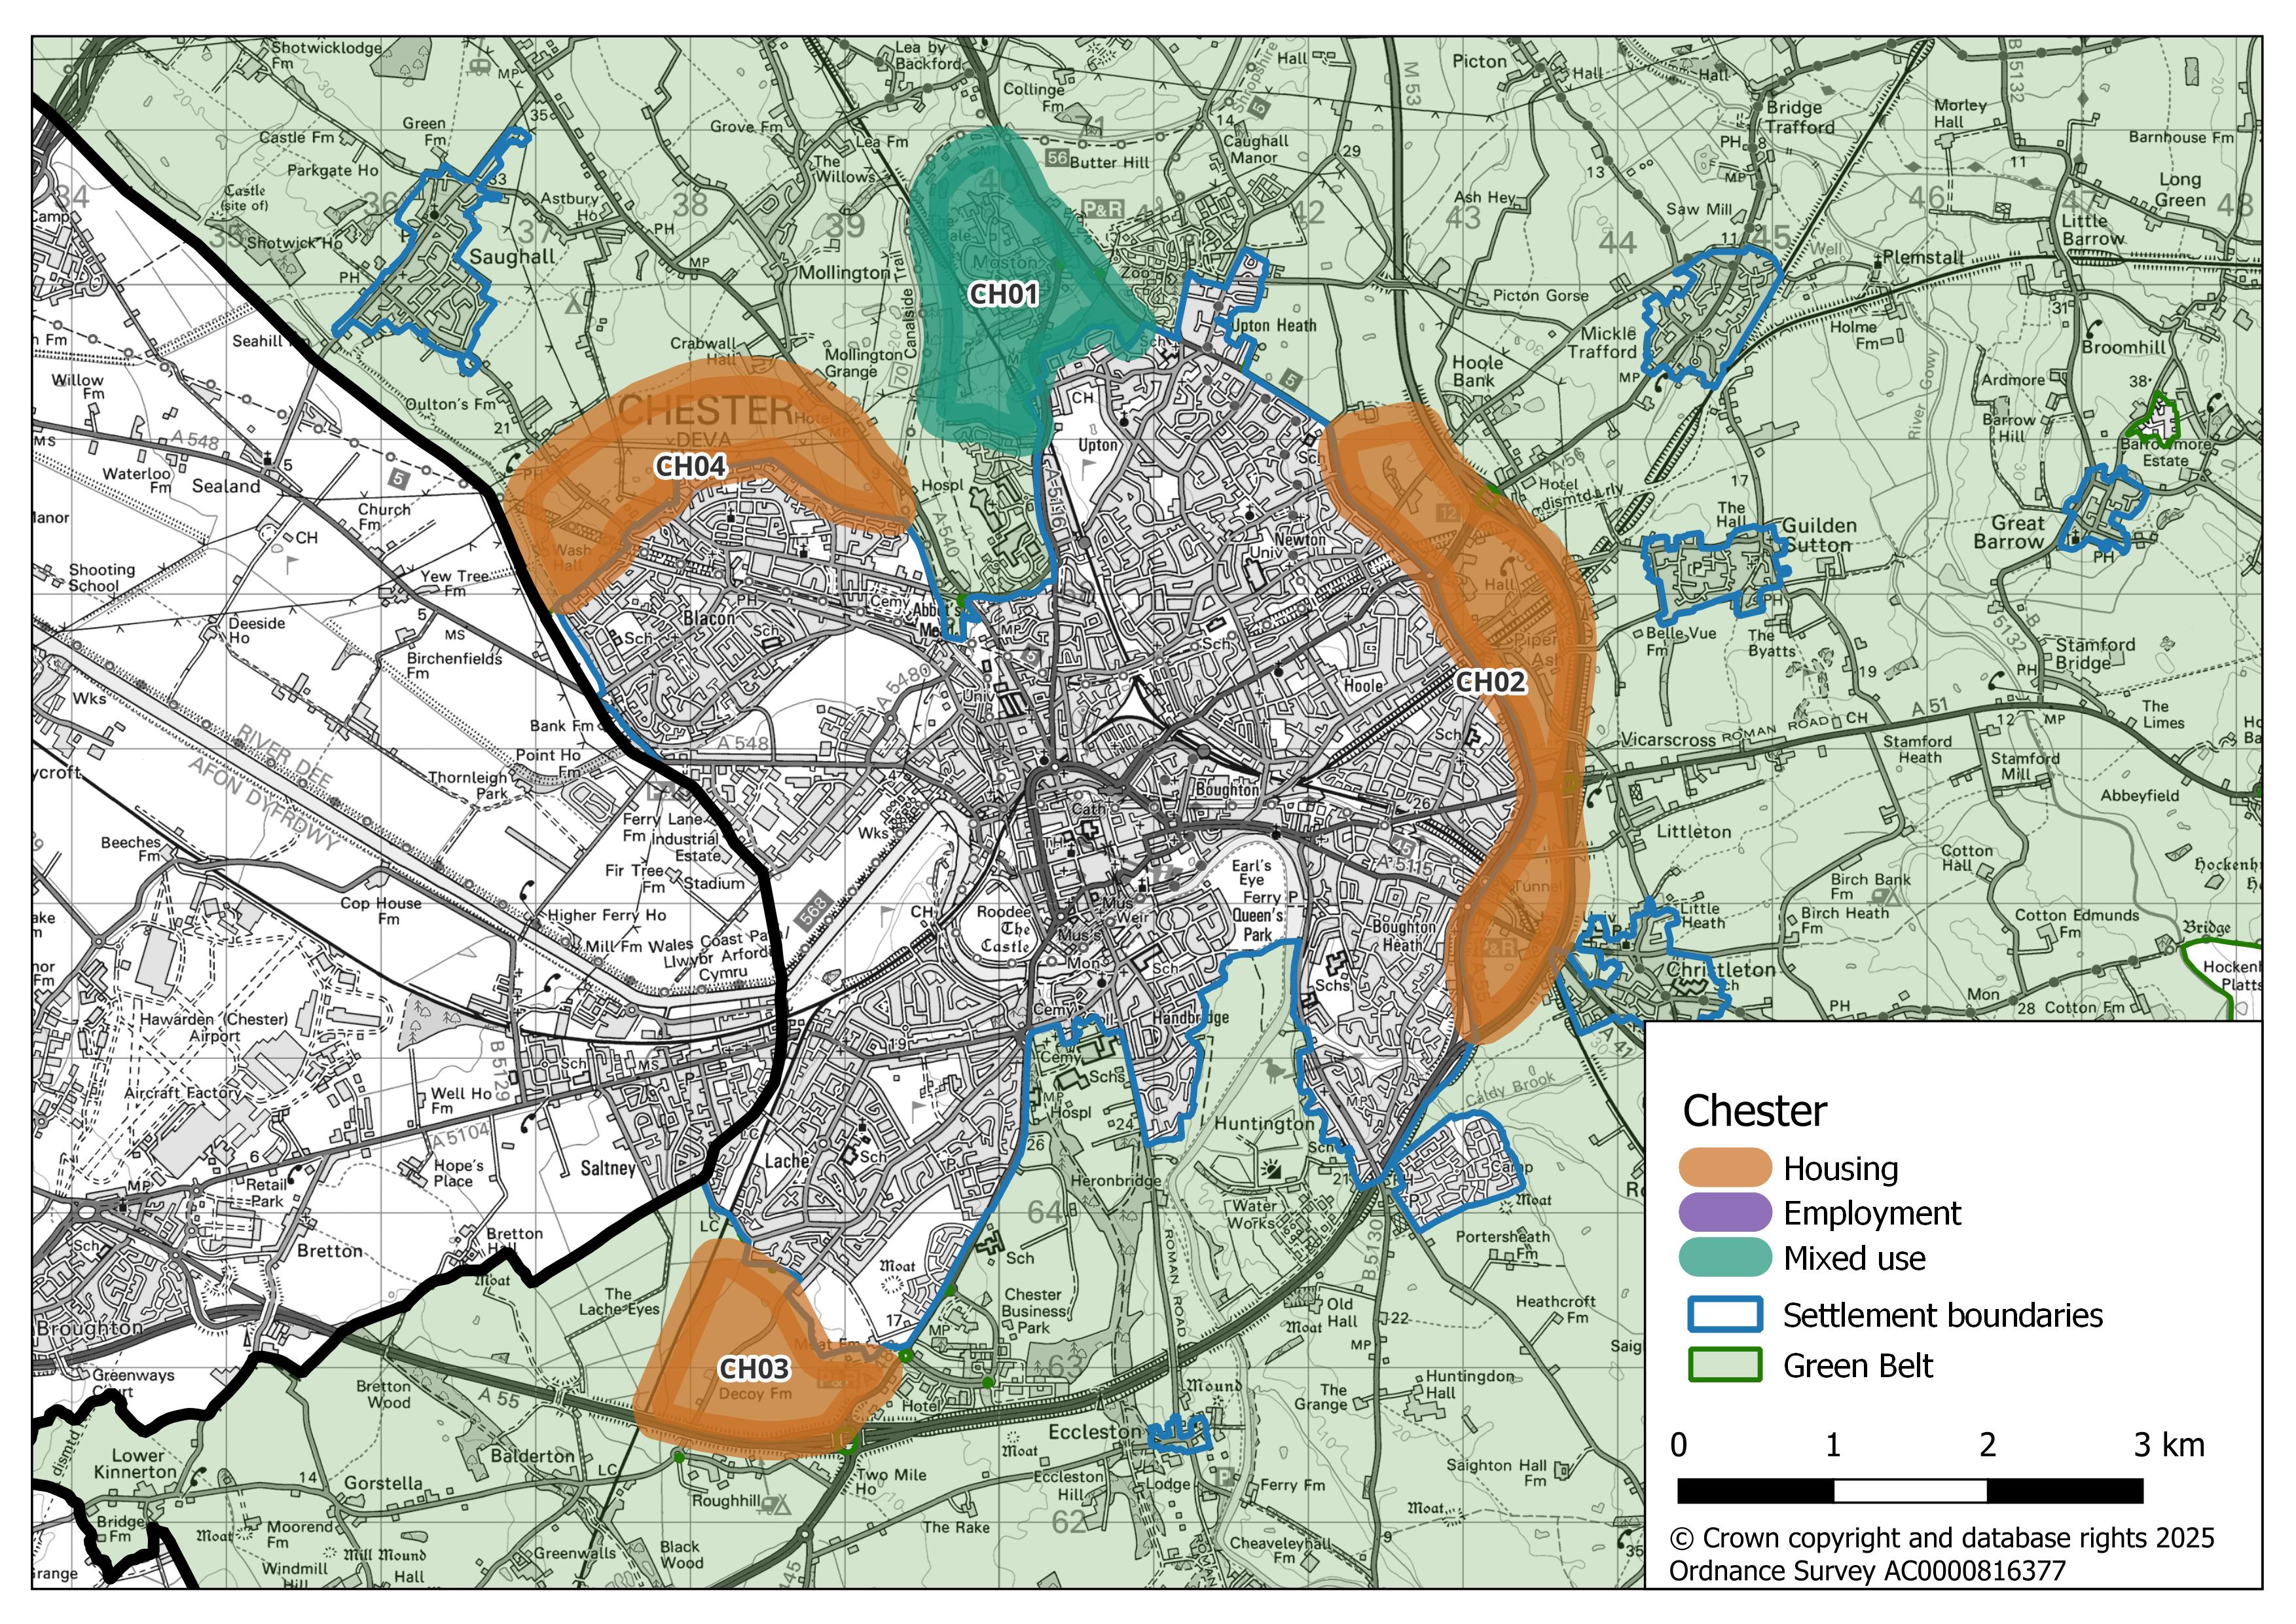
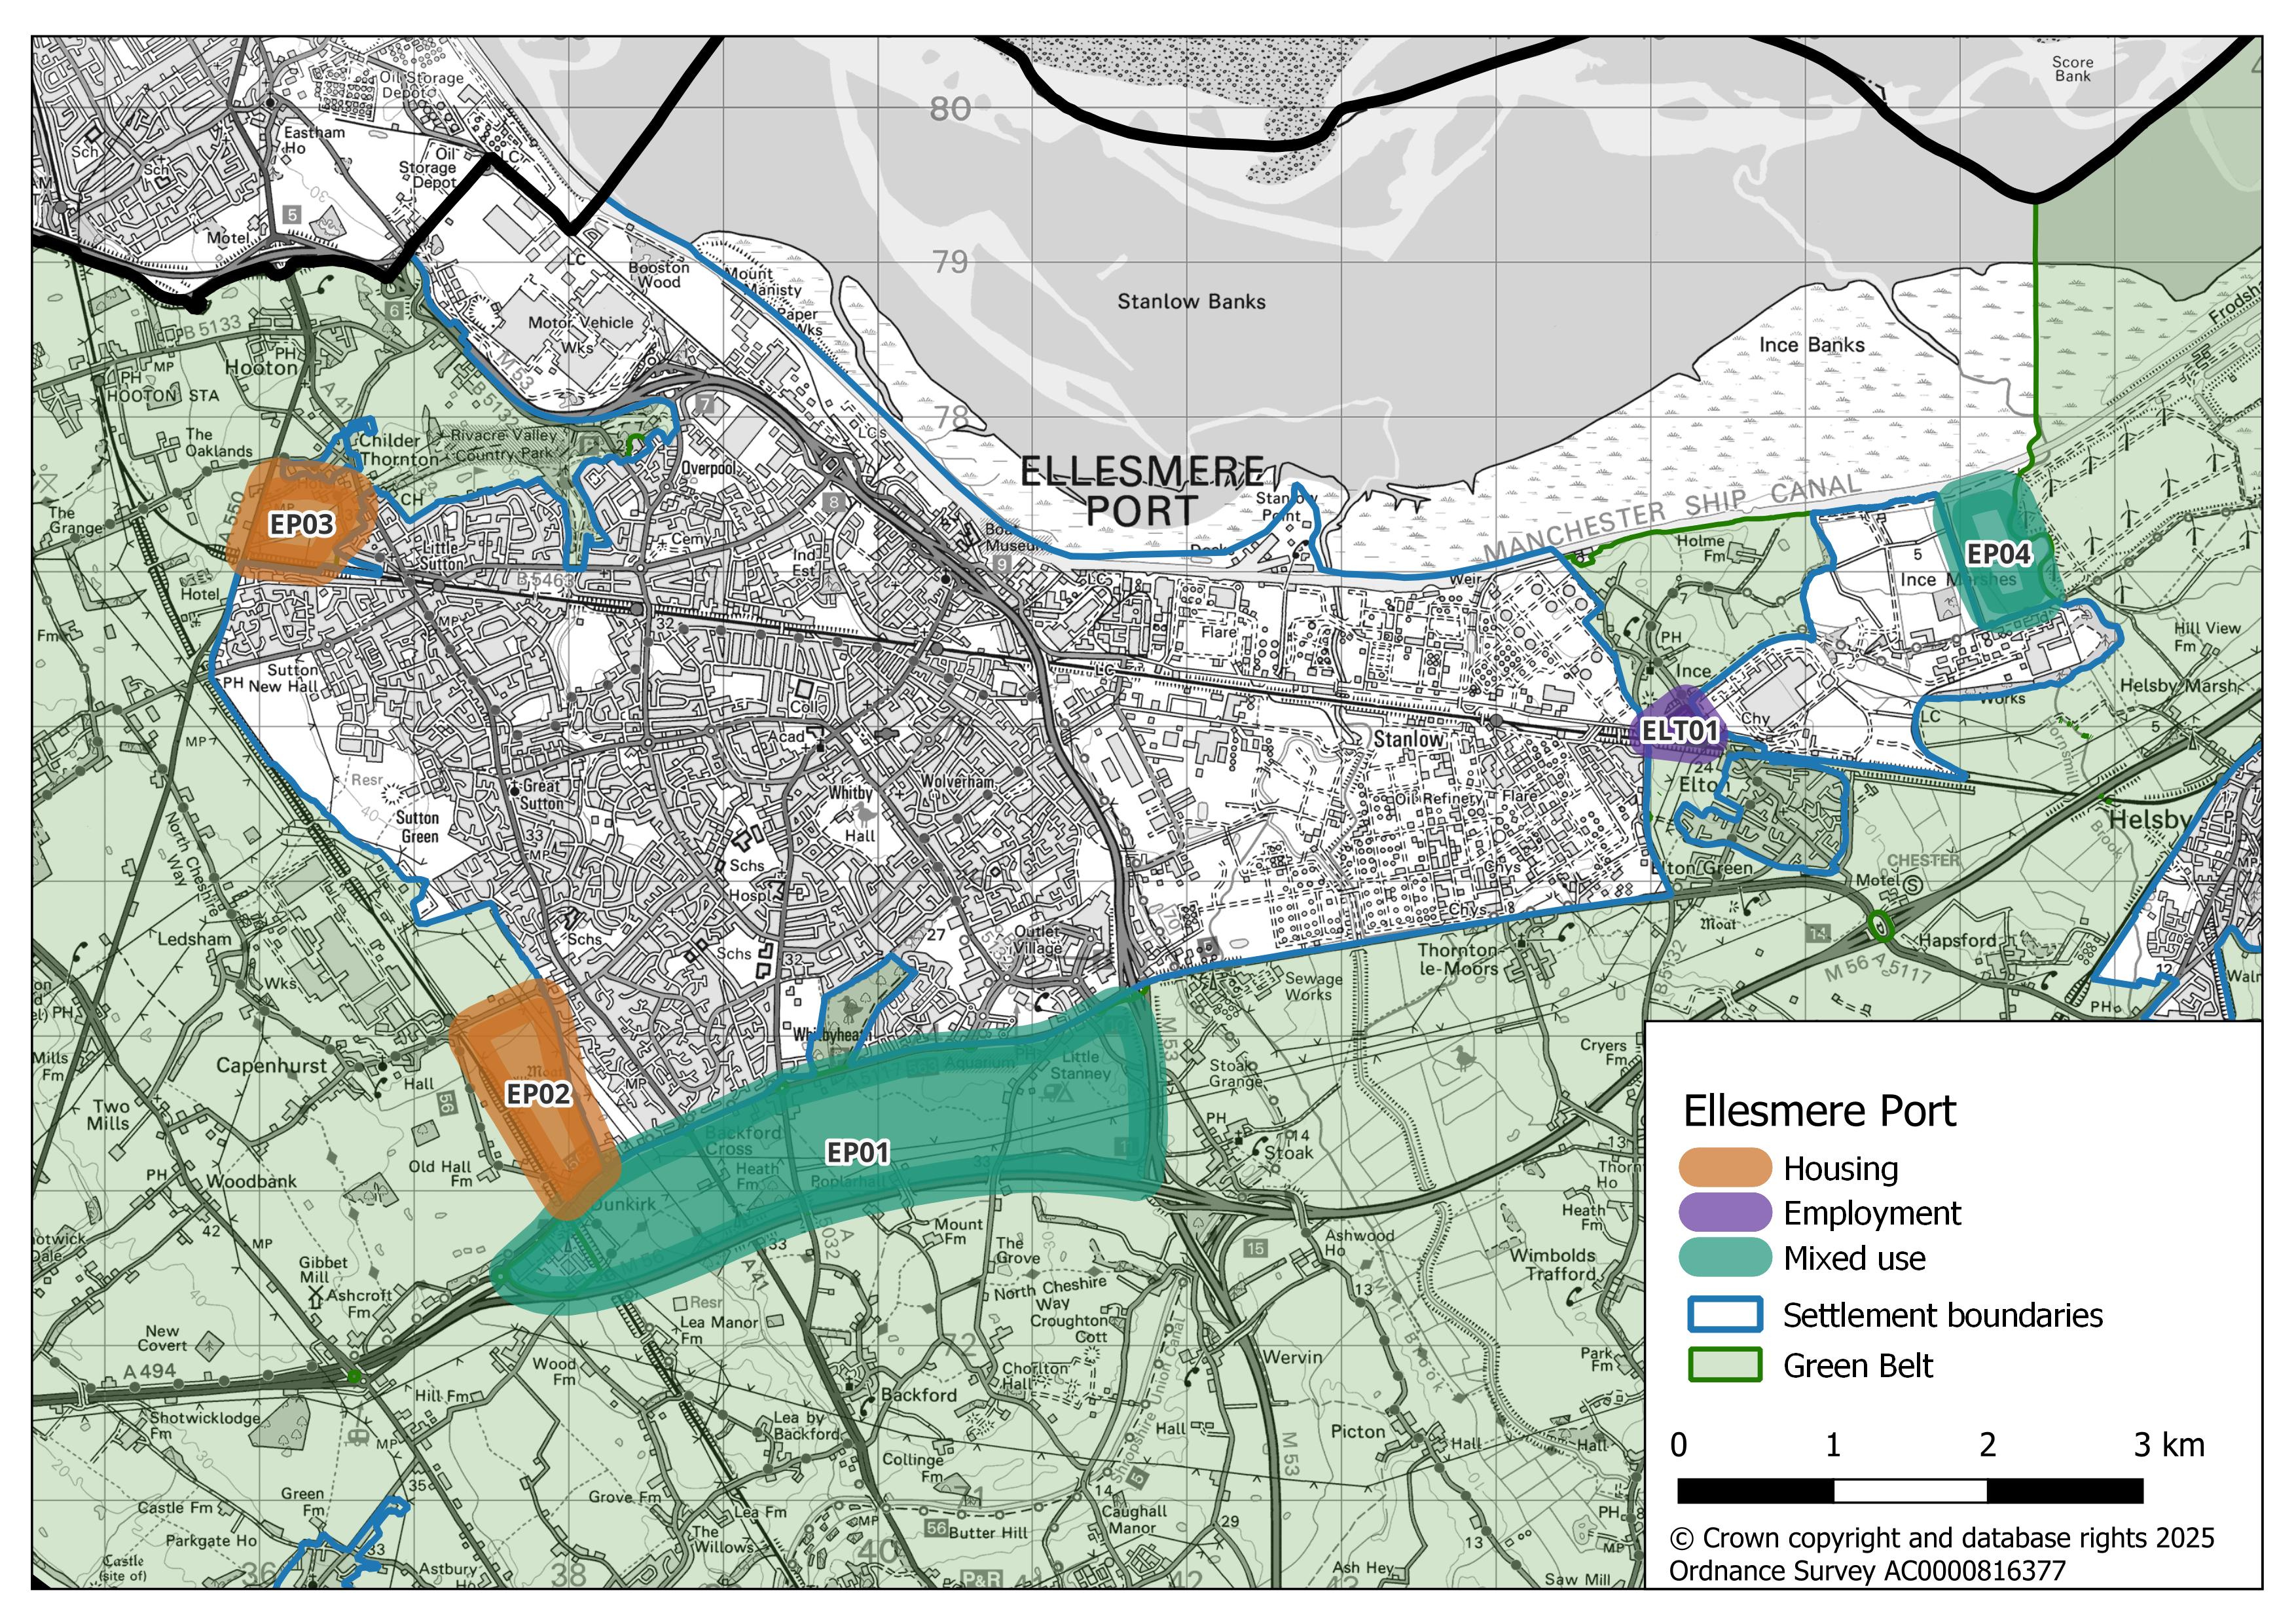
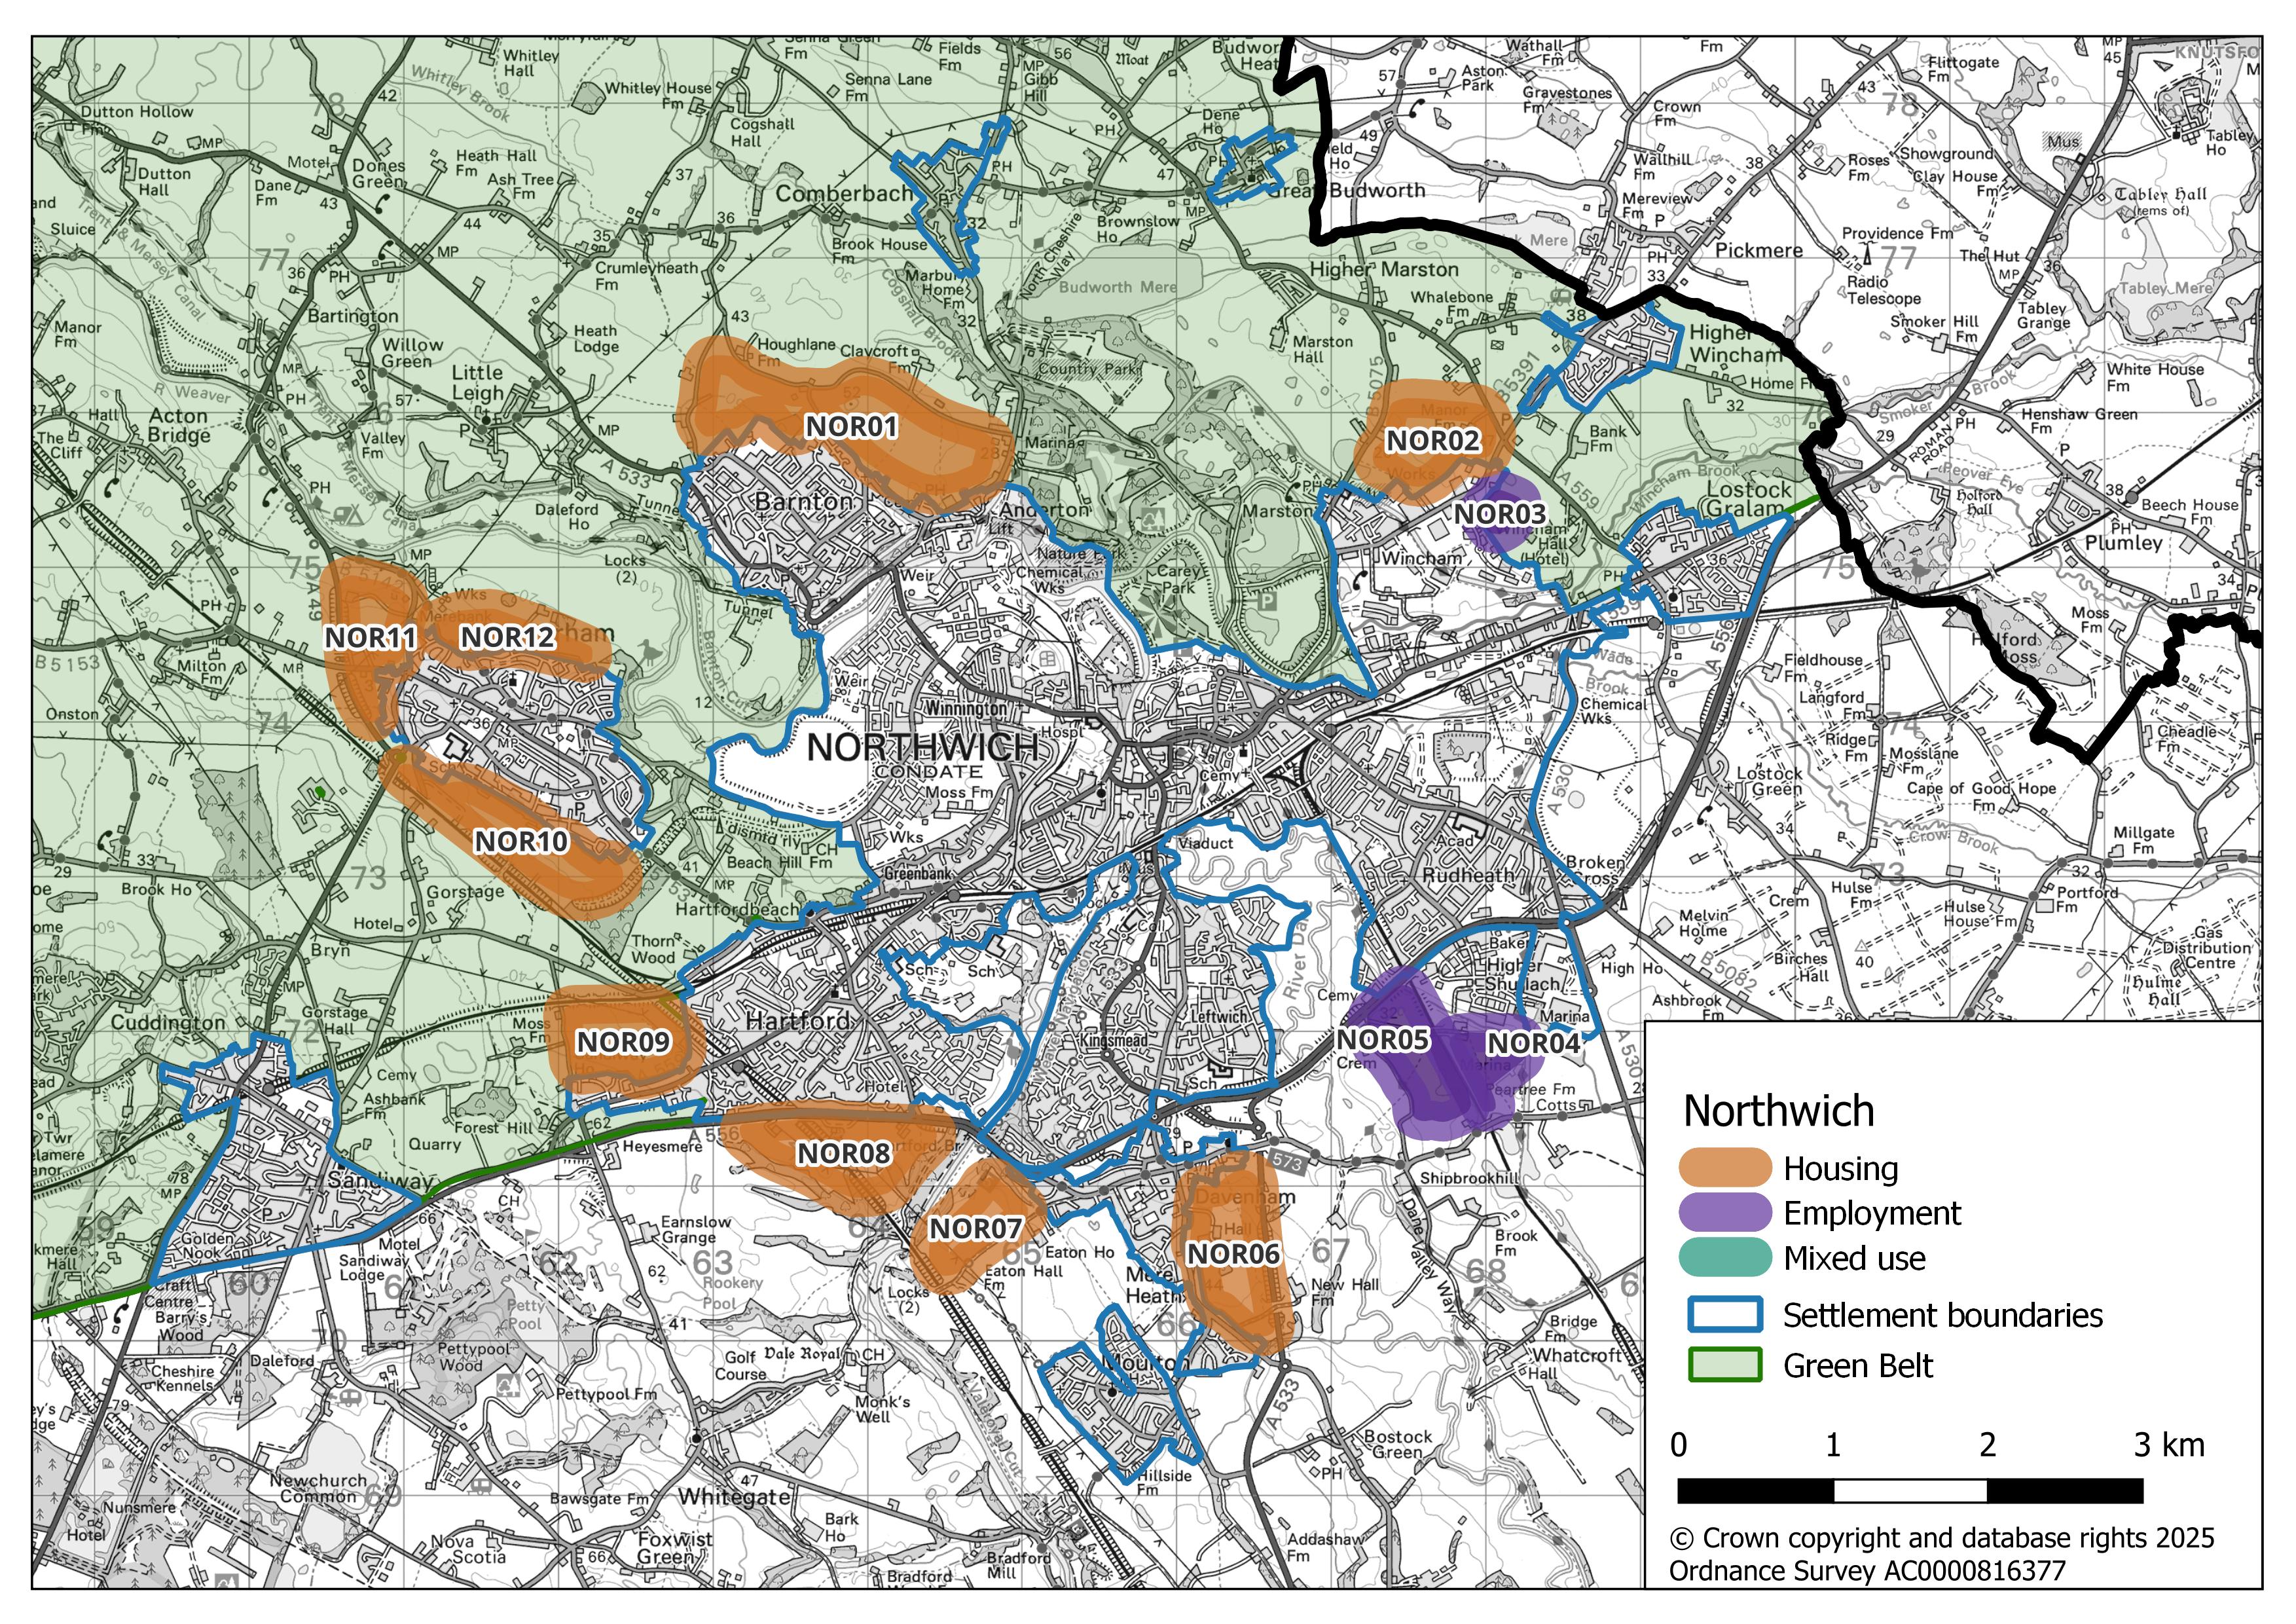
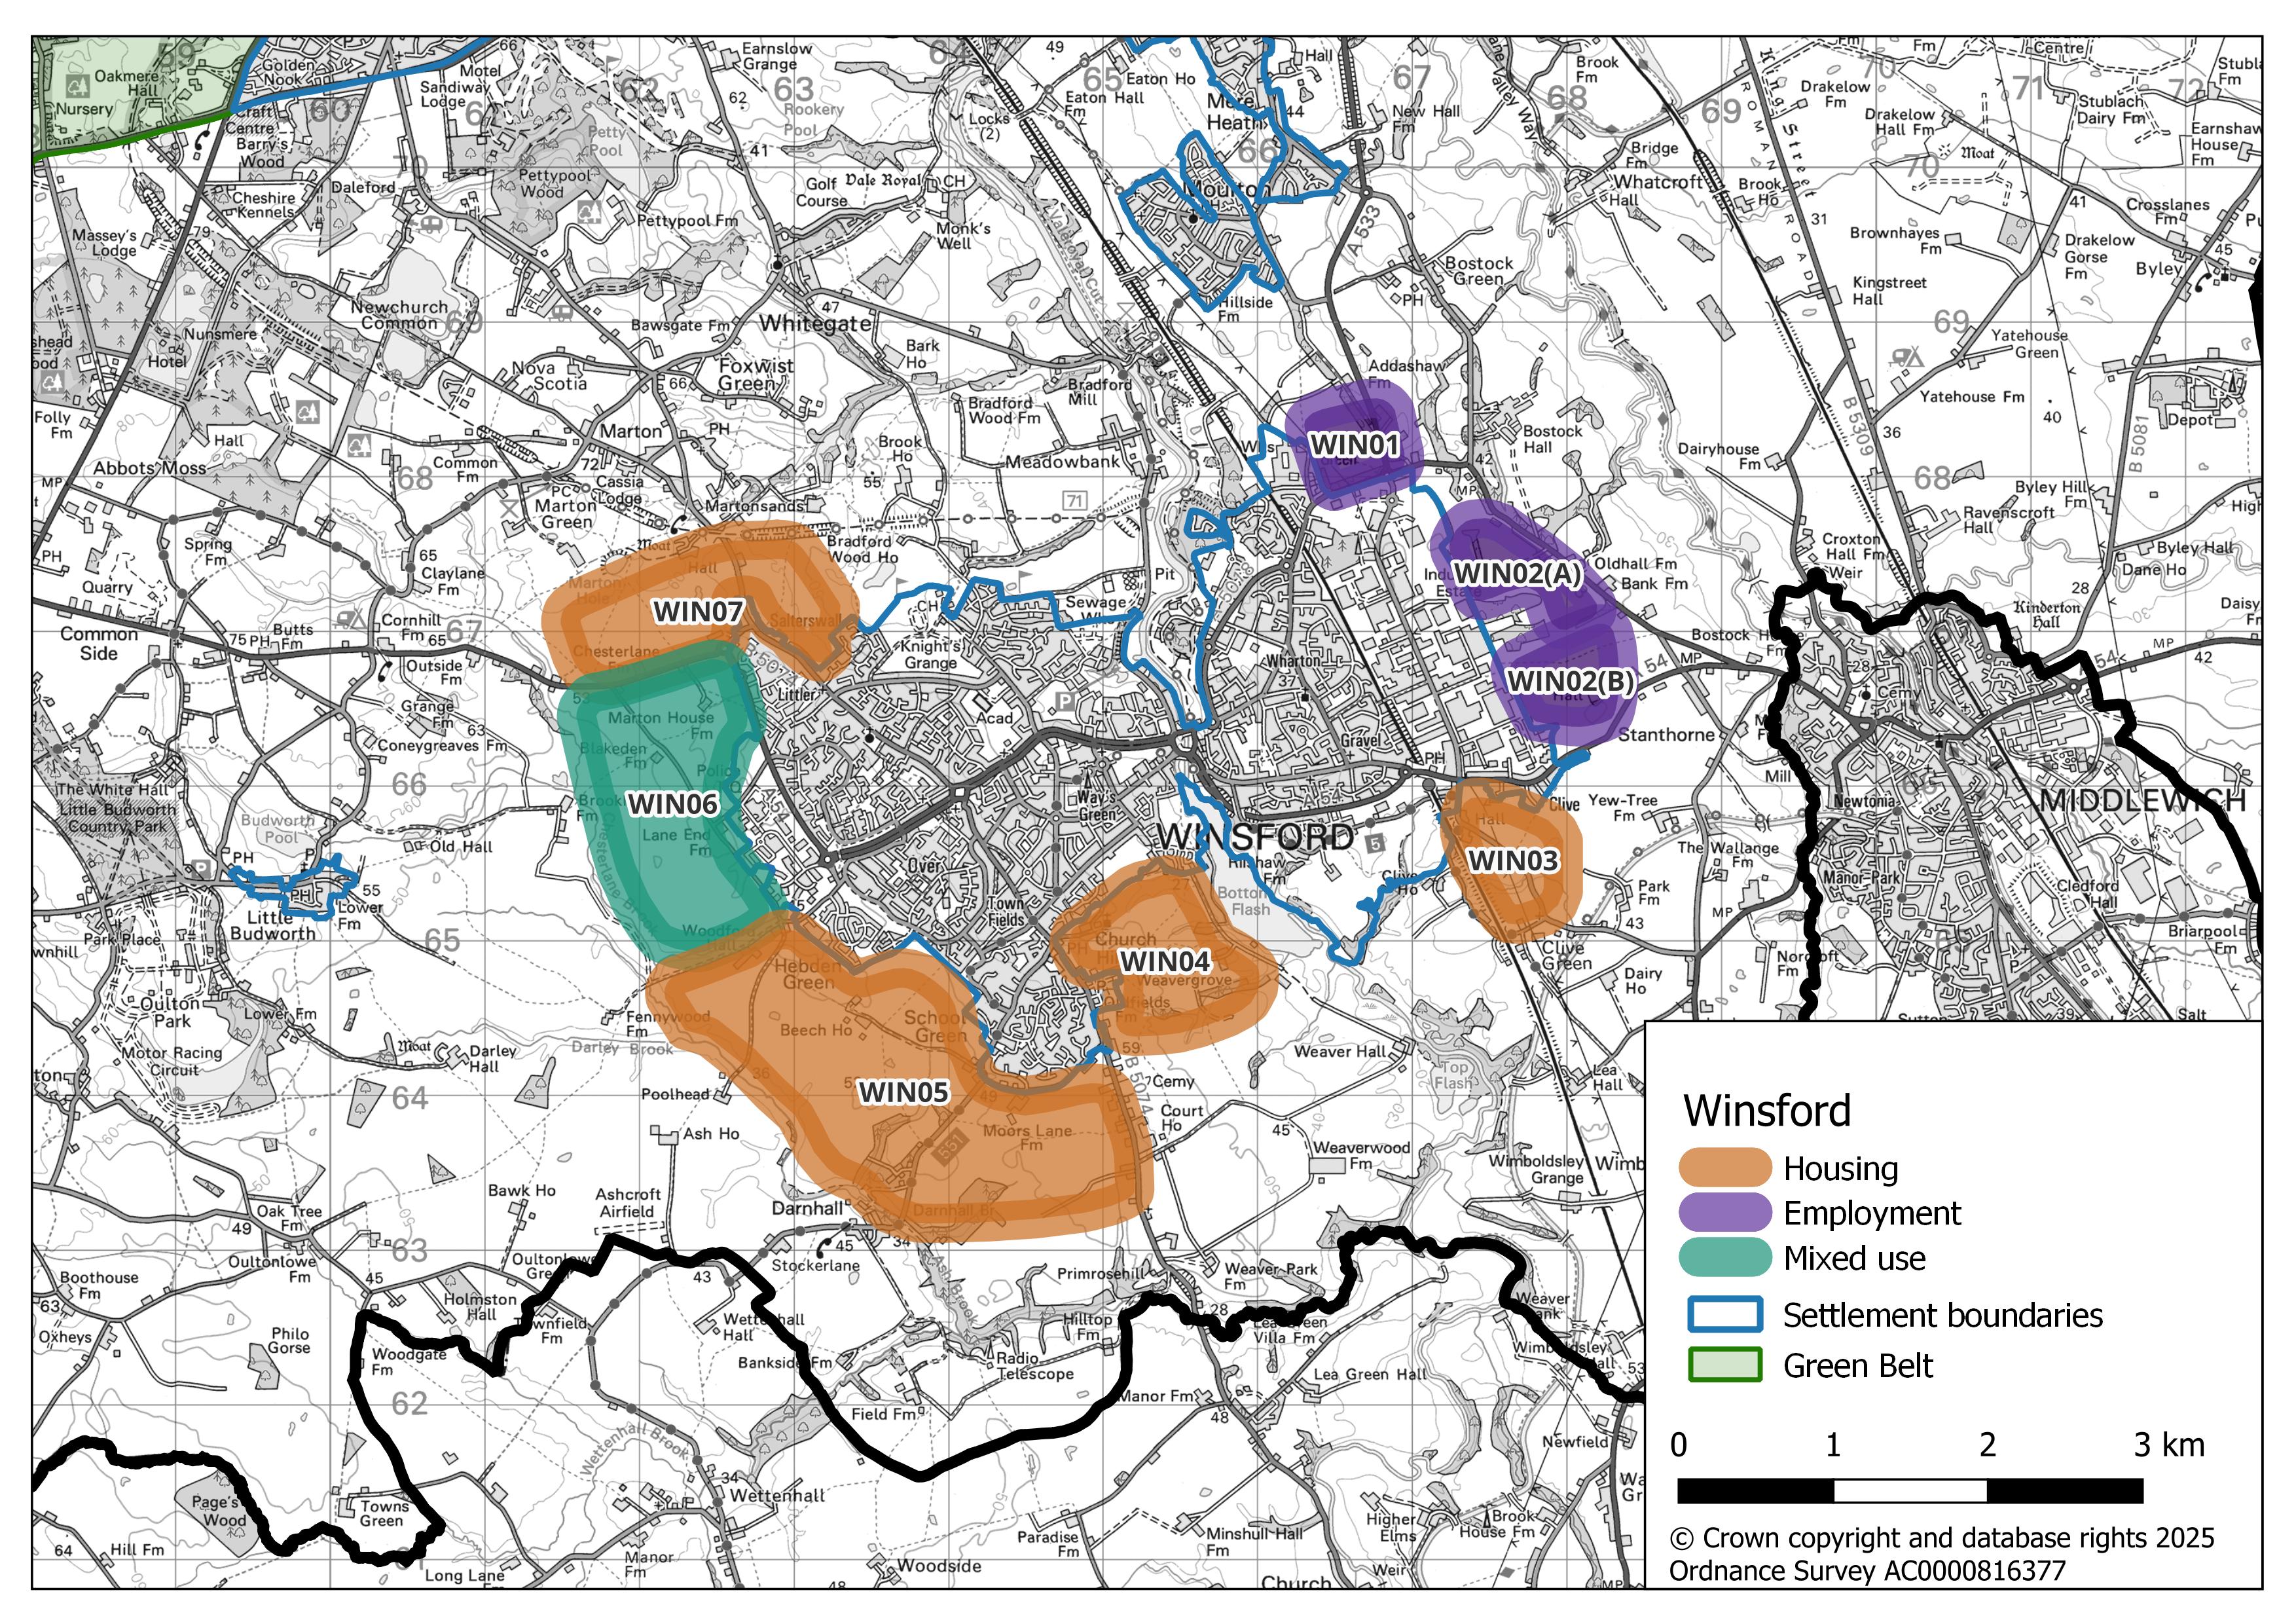
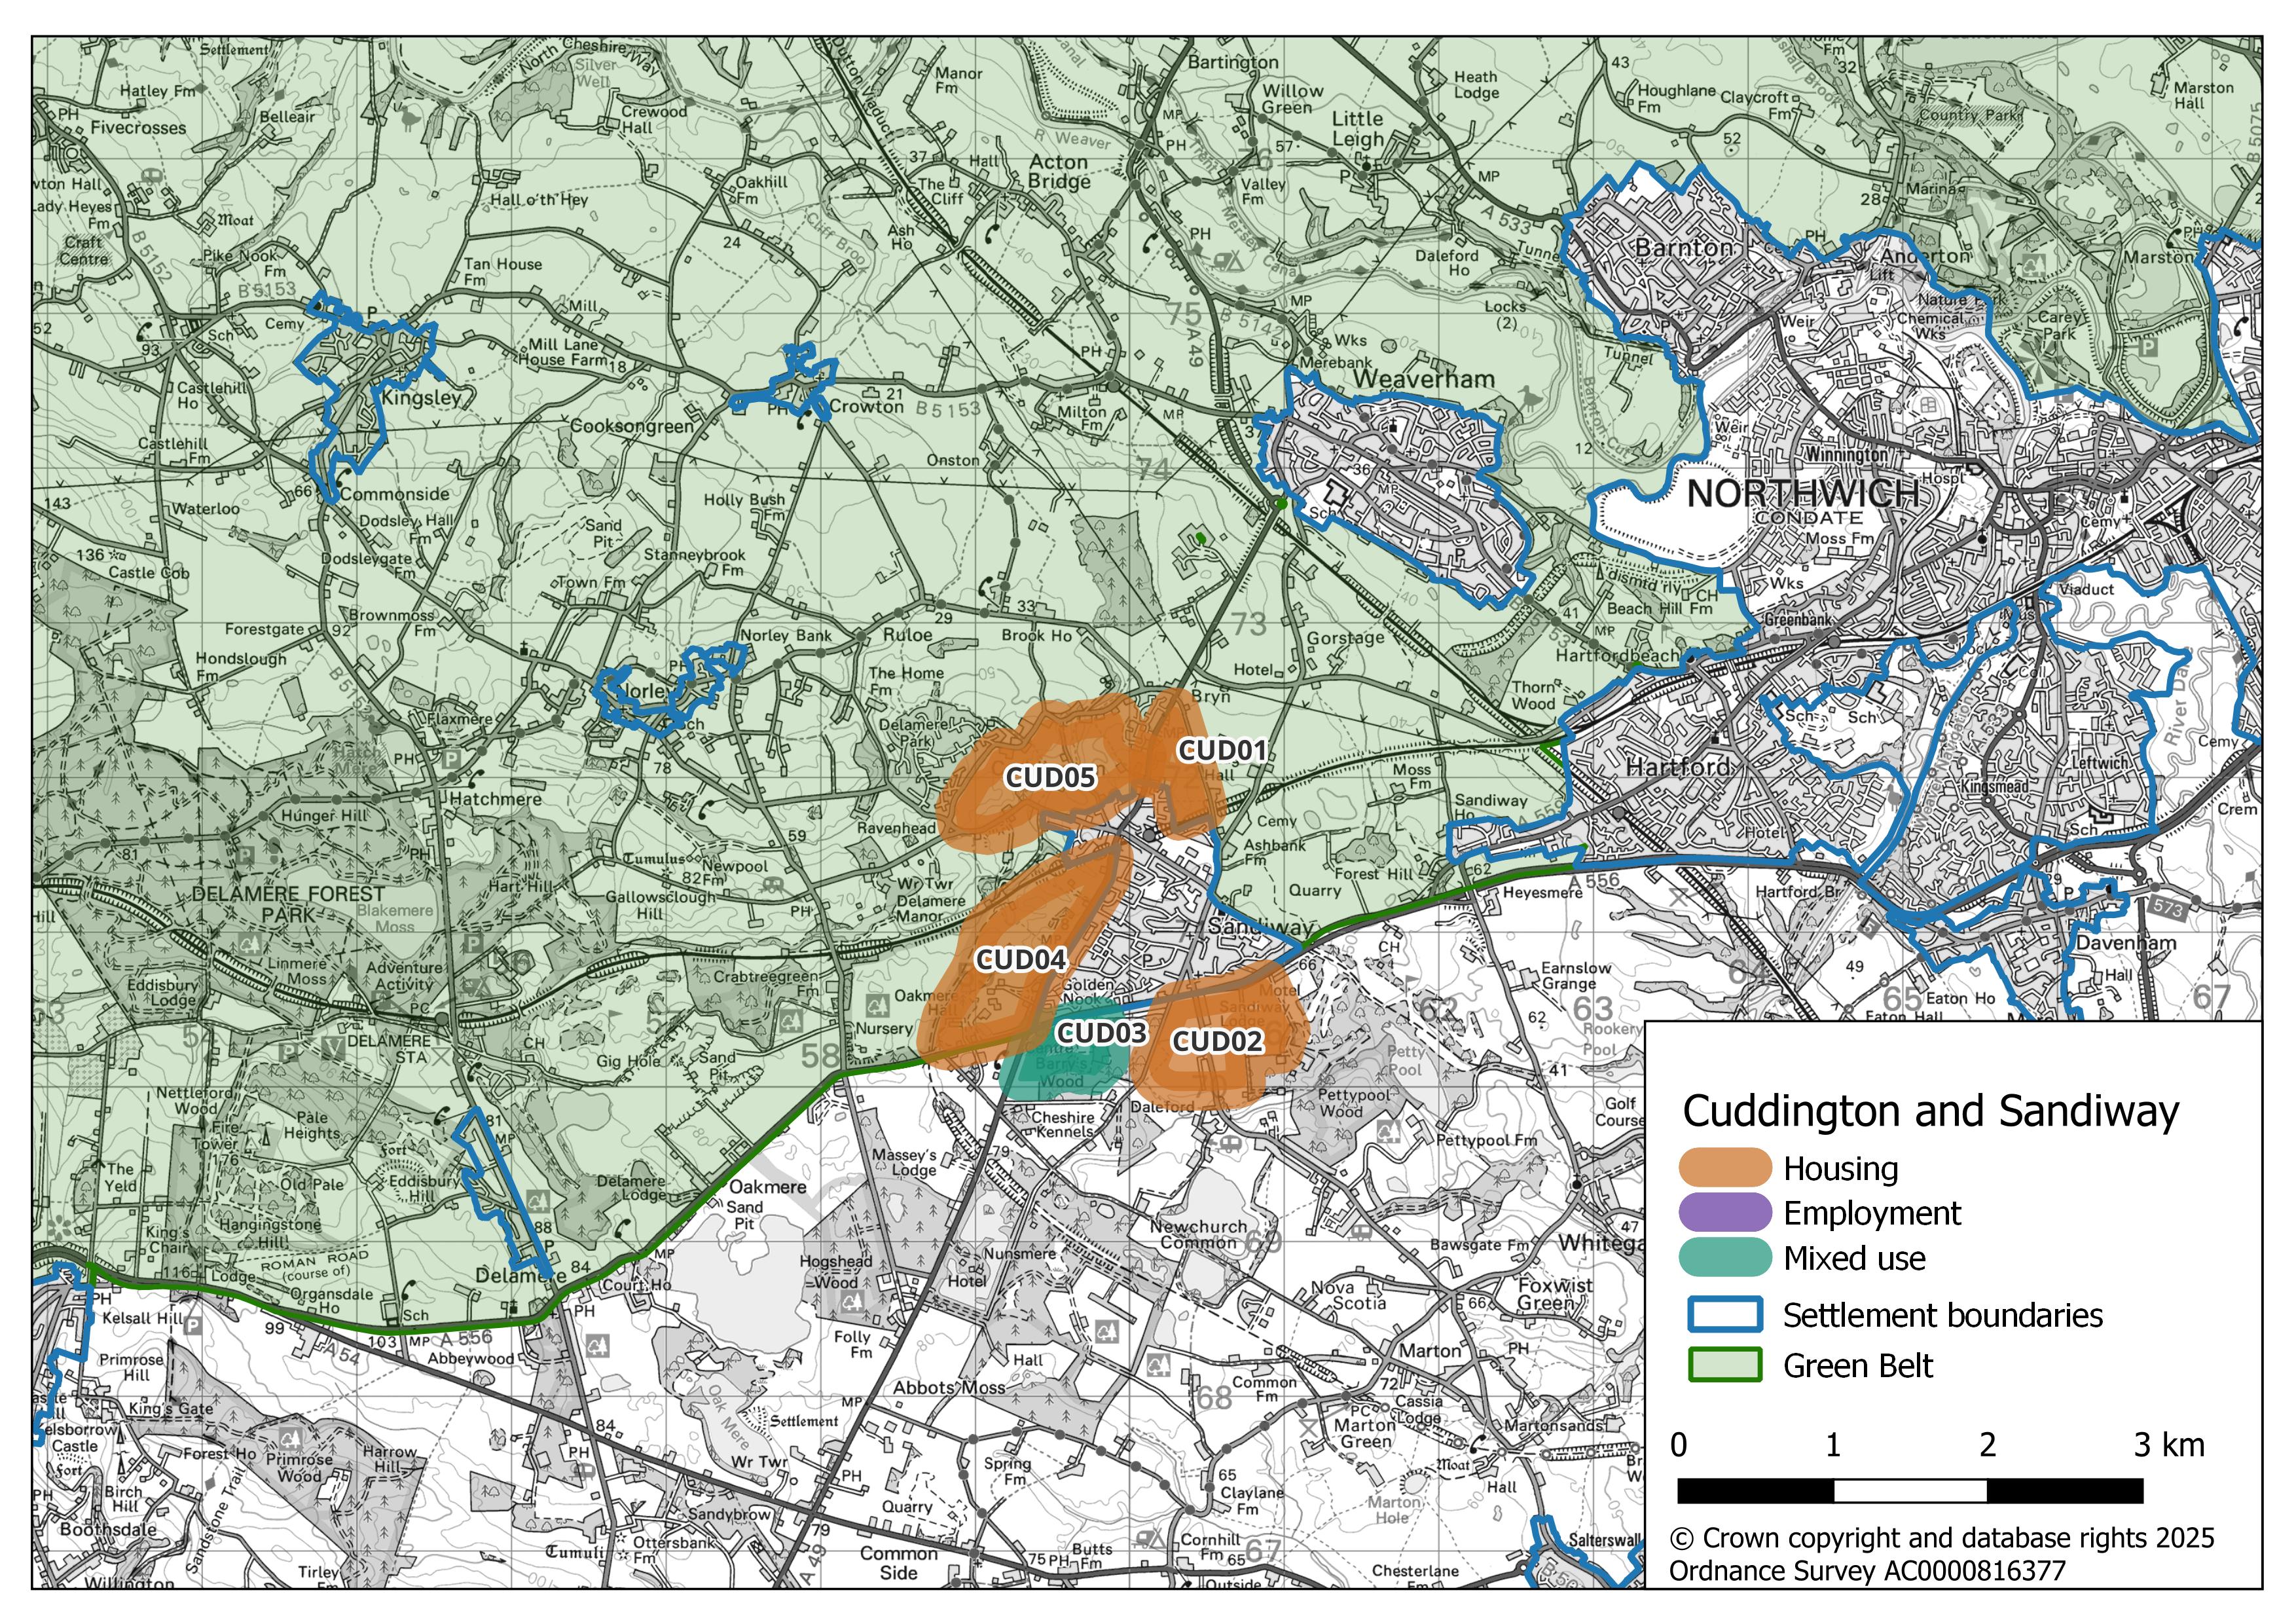
5.9 The following section presents a series of maps of potential growth areas on the edge of the city, main towns, market towns and larger villages, along with the rural rail stations in the borough. Each map identifies which growth areas align with which spatial option.
5.10 A summary table of all of the potential growth areas, including current planning permissions, estimated developable area, and potential housing and employment capacity, is included in Appendix B ‘Potential growth areas - additional information’
5.11 In identifying these areas we have consider sites submitted to us through previous ‘call for sites’ exercises, undeveloped Local Plan allocations, and a desktop review of existing information.
5.12 We have excluded areas of land that are subject to constraints that would act as potential ‘showstoppers’ to restrict future development, including: Local Green Spaces; designated habitats sites; Sites of Special Scientific Interest; irreplaceable habitats; designated heritage assets; key settlement gaps; Areas of Special County Value; strategic open space; areas of flood risk; and significant hazard zones.
5.13 This has resulted in approximately 100 areas being identified for potential growth and/or future allocation in the new Local Plan.
It is important to note that until we know what the spatial strategy for the new Local Plan is, no decisions have been made for the location and scale of new development that might be necessary.
The inclusion of any of the potential growth areas in this Issues and Options consultation does not indicate that the Council supports their development, given the early stage of plan preparation.
Furthermore, not all of the identified growth areas would be required under any of the spatial options, nor would the full extent of any area necessarily need to be developed.
Additional technical work will need to be carried out to look in more detail at the constraints, infrastructure capacity and deliverability of all of the potential growth areas.
5.14 Further detailed assessment will be required if any of the potential growth areas are be taken forward as allocations in the new Local Plan.
Question SS 20
Do you think that the potential ‘showstopper’ constraints identified above, are correct or are there any others that we should consider?
Question SS 21
What information should we take into account when assessing sites for allocation in the new Local Plan?
Question SS 22
Do you have any other comments or suggestions you wish to make about our approach to identifying potential growth areas or allocations in the new Local Plan?
Question SS 23
Which of the identified potential growth areas around Chester do you consider to be the most suitable?
Question SS 24
Do you have any further comments about any of the potential growth areas identified around Chester?
Question SS 25
Are there any constraints, including infrastructure provision, that should be considered for Chester when developing the new Local Plan?
Question SS 26
Which of the identified potential growth areas around Ellesmere Port do you consider to be the most suitable?
Question SS 27
Do you have any further comments about any of the potential growth areas identified around Ellesmere Port?
Question SS 28
Are there any constraints, including infrastructure provision, that should be considered for Ellesmere Port when developing the new Local Plan?
Question SS 29
Which of the identified potential growth areas around Northwich do you consider to be the most suitable?
Question SS 30
Do you have any further comments about any of the potential growth areas identified around Northwich?
Question SS 31
Are there any constraints, including infrastructure provision, that should be considered for Northwich when developing the new Local Plan?
Question SS 32
Which of the identified potential growth areas around Winsford do you consider to be the most suitable?
Question SS 33
Do you have any further comments about any of the potential growth areas identified around Winsford?
Question SS 34
Are there any constraints, including infrastructure provision, that should be considered for Winsford when developing the new Local Plan?
Question SS 35
Which of the identified potential growth areas around Cuddington and Sandiway do you consider to be the most suitable?
Question SS 36
Do you have any further comments about any of the potential growth areas identified around Cuddington and Sandiway?
Question SS 37
Are there any constraints, including infrastructure provision, that should be considered for Cuddington and Sandiway when developing the new Local Plan?
Question SS 38
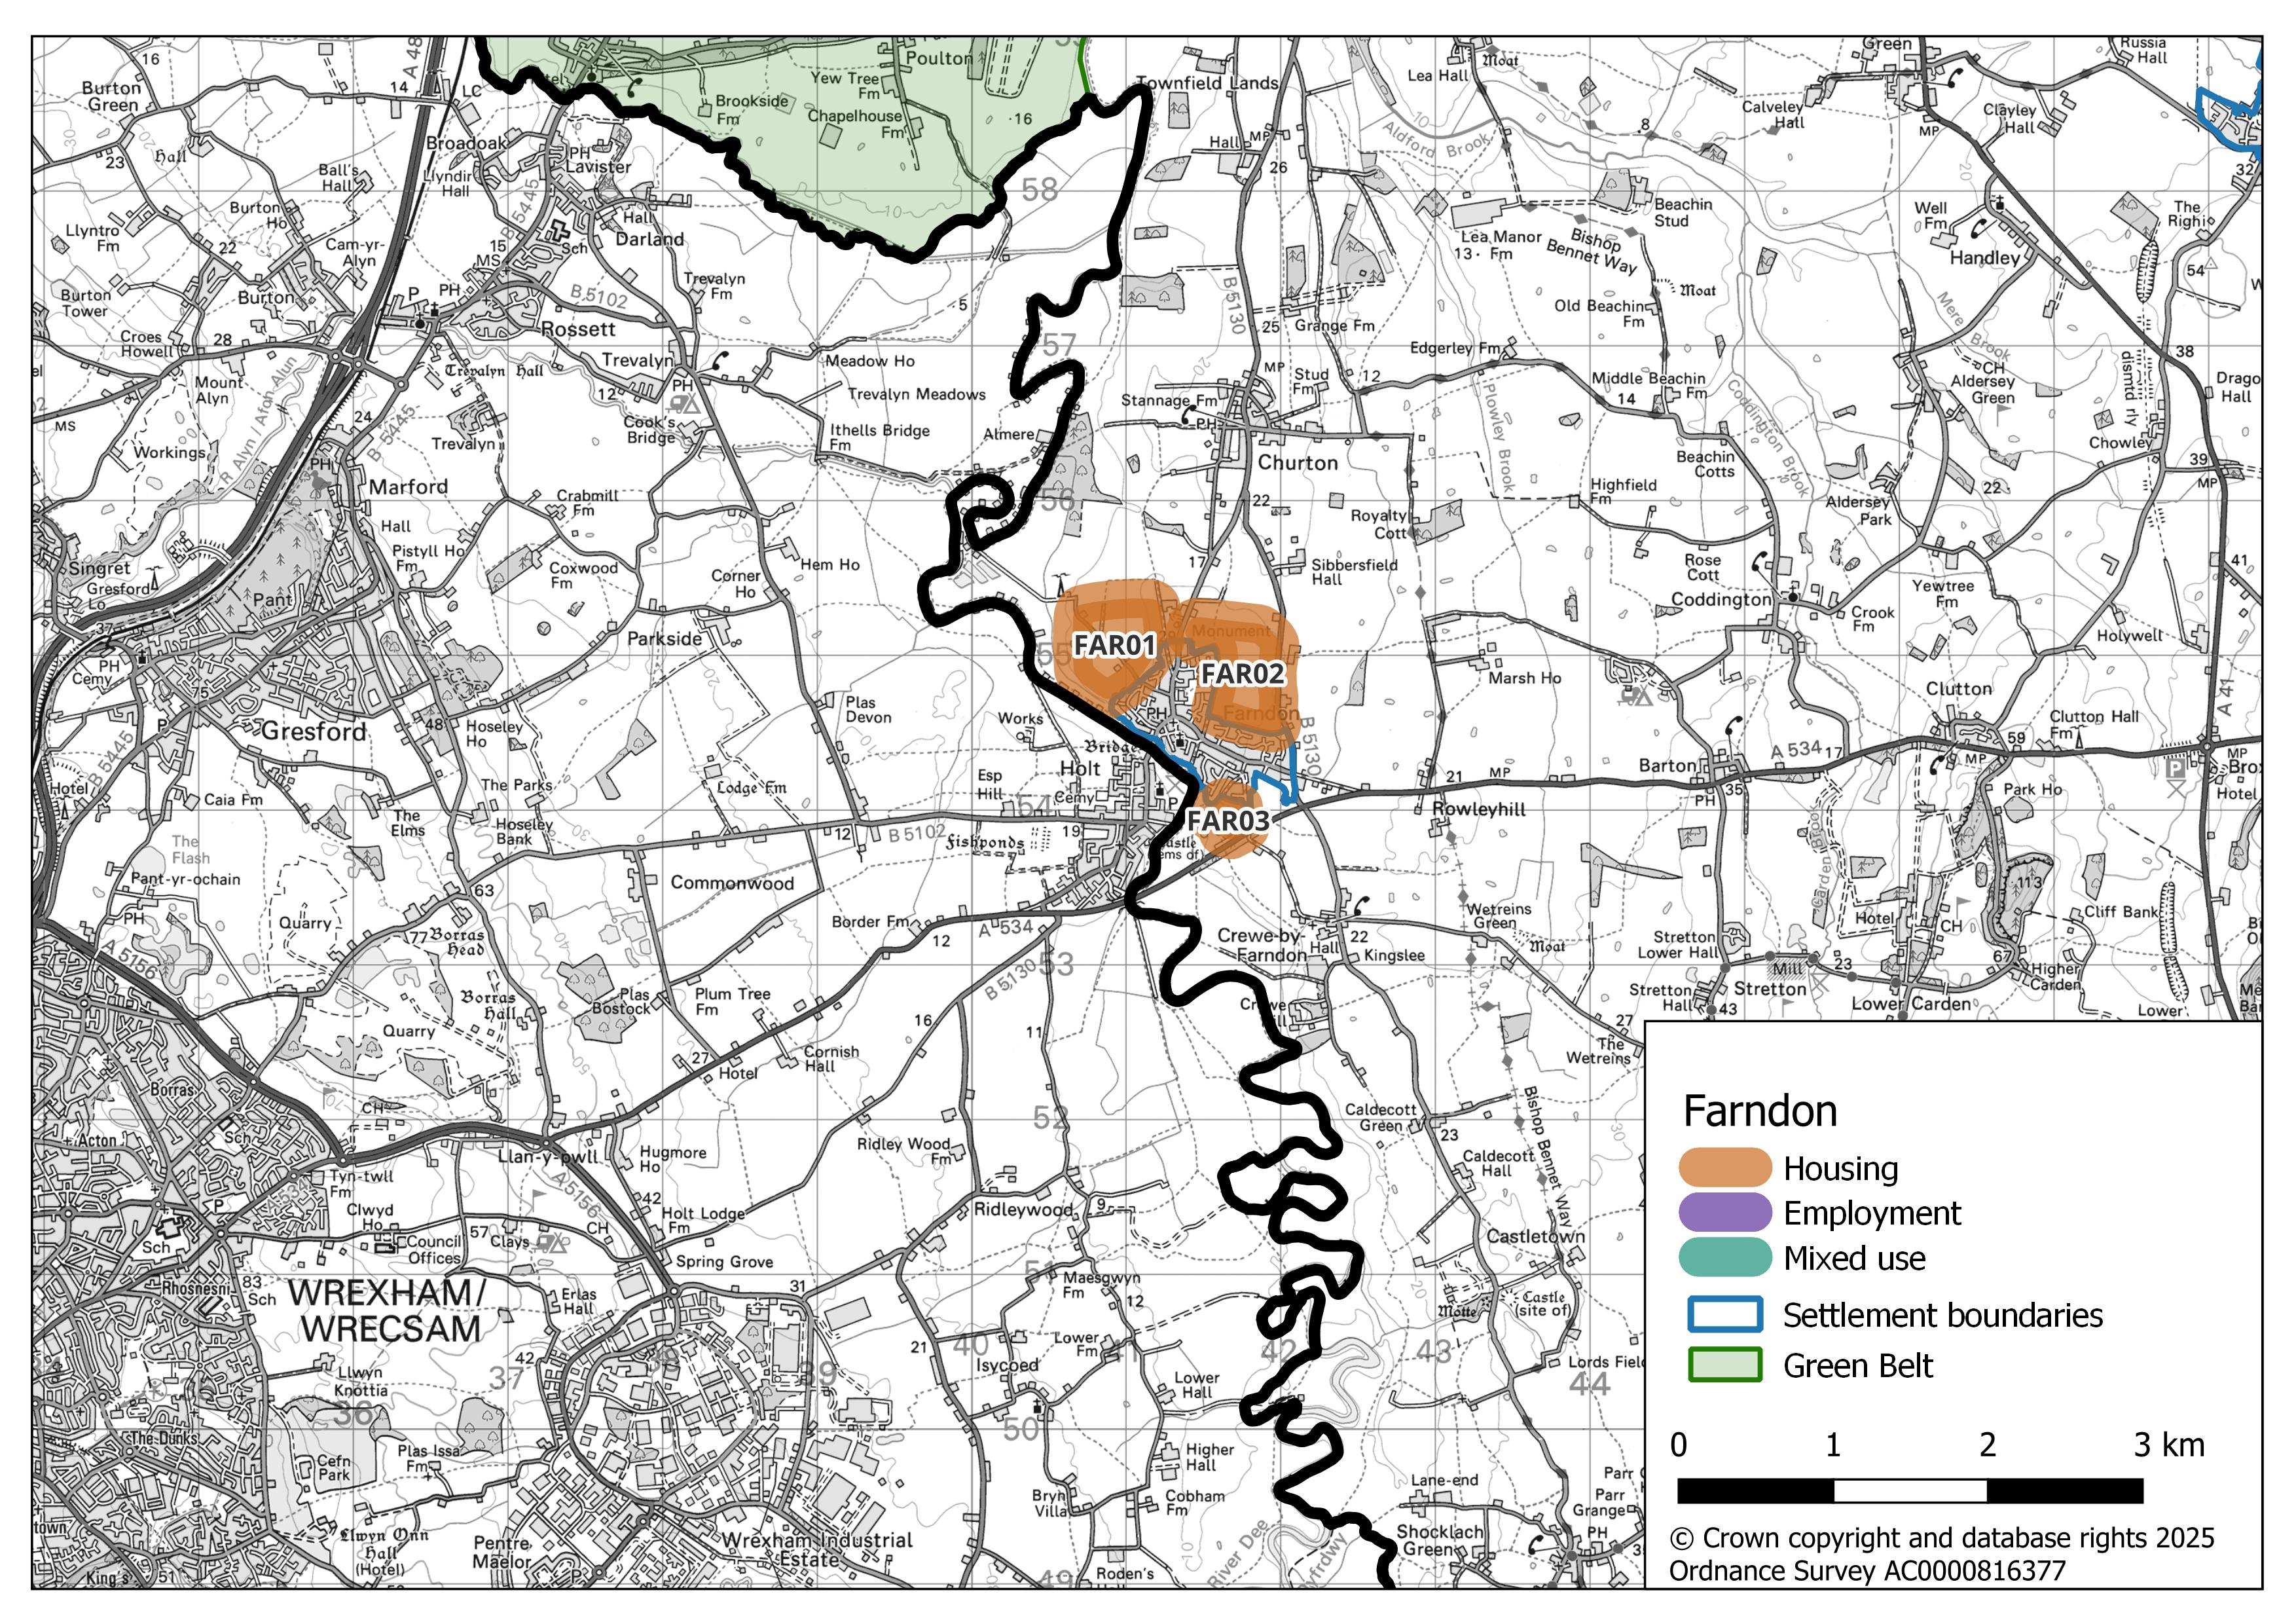
Which of the identified potential growth areas around Farndon do you consider to be the most suitable?
Question SS 39
Do you have any further comments about any of the potential growth areas identified around Farndon?
Question SS 40
Are there any constraints, including infrastructure provision, that should be considered for Farndon when developing the new Local Plan?
Question SS 41
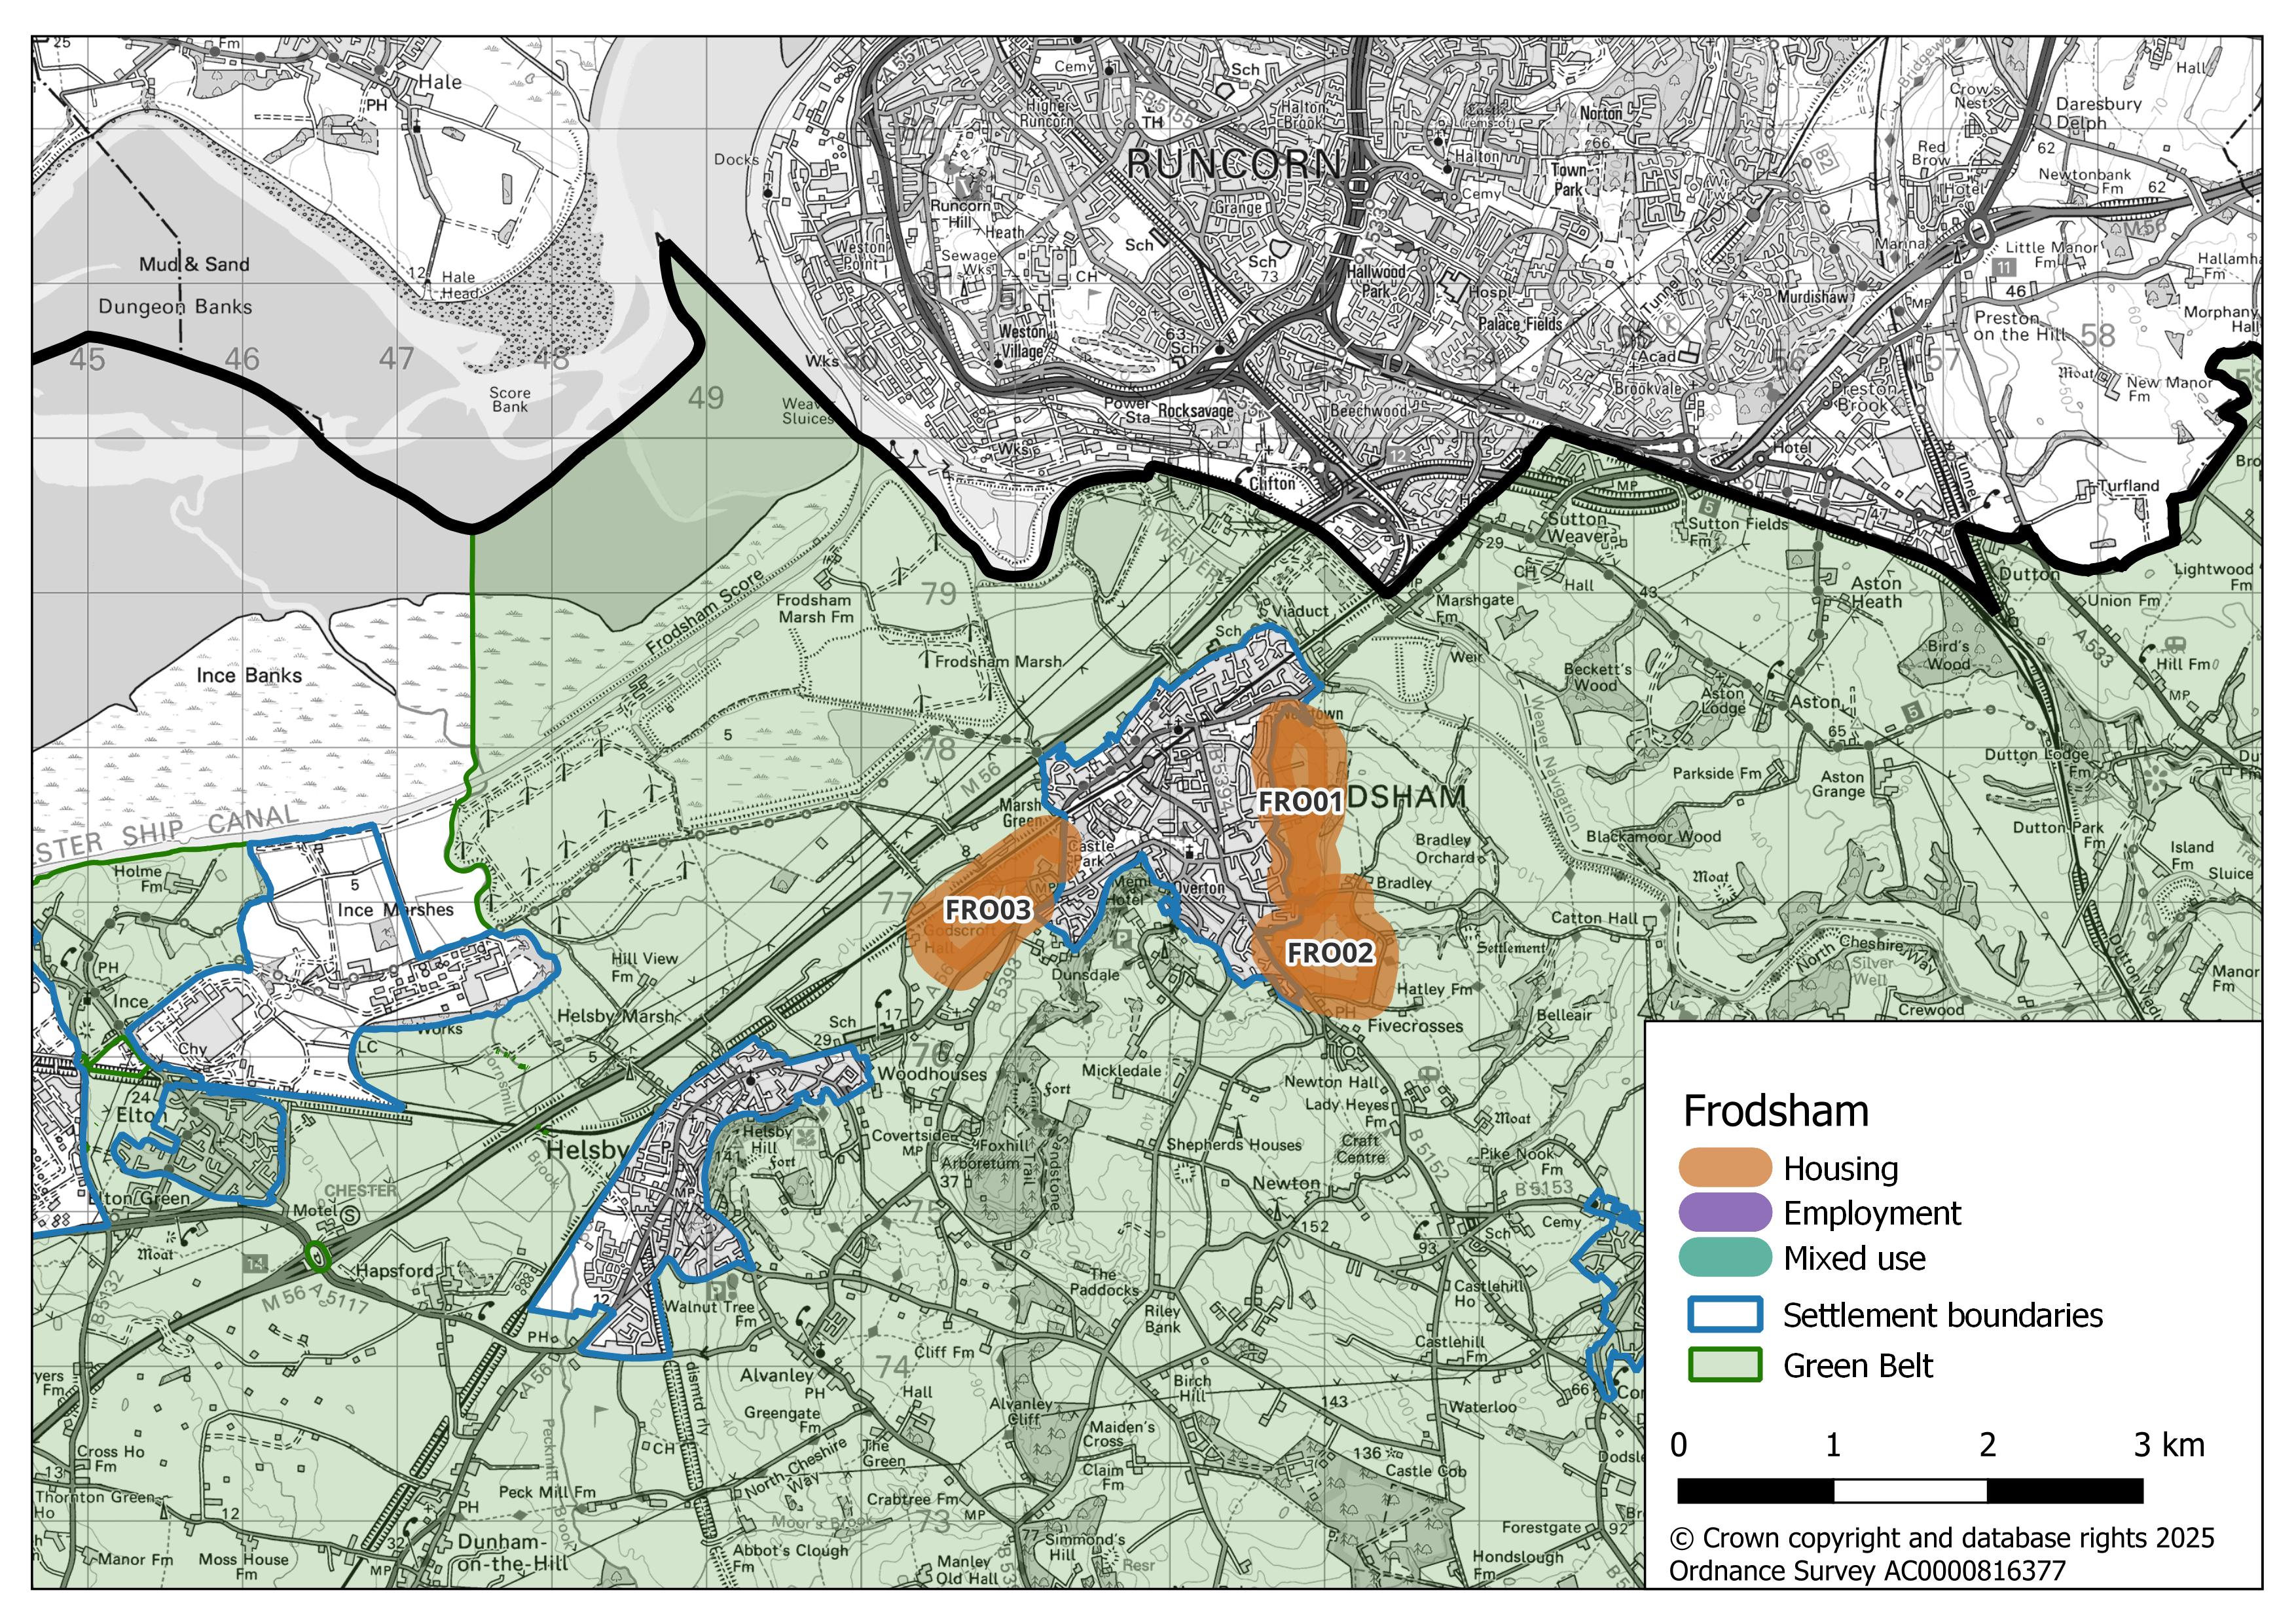
Which of the identified potential growth areas around Frodsham do you consider to be the most suitable?
Question SS 42
Do you have any further comments about any of the potential growth areas identified around Frodsham?
Question SS 43
Are there any constraints, including infrastructure provision, that should be considered for Frodsham when developing the new Local Plan?
Question SS 44
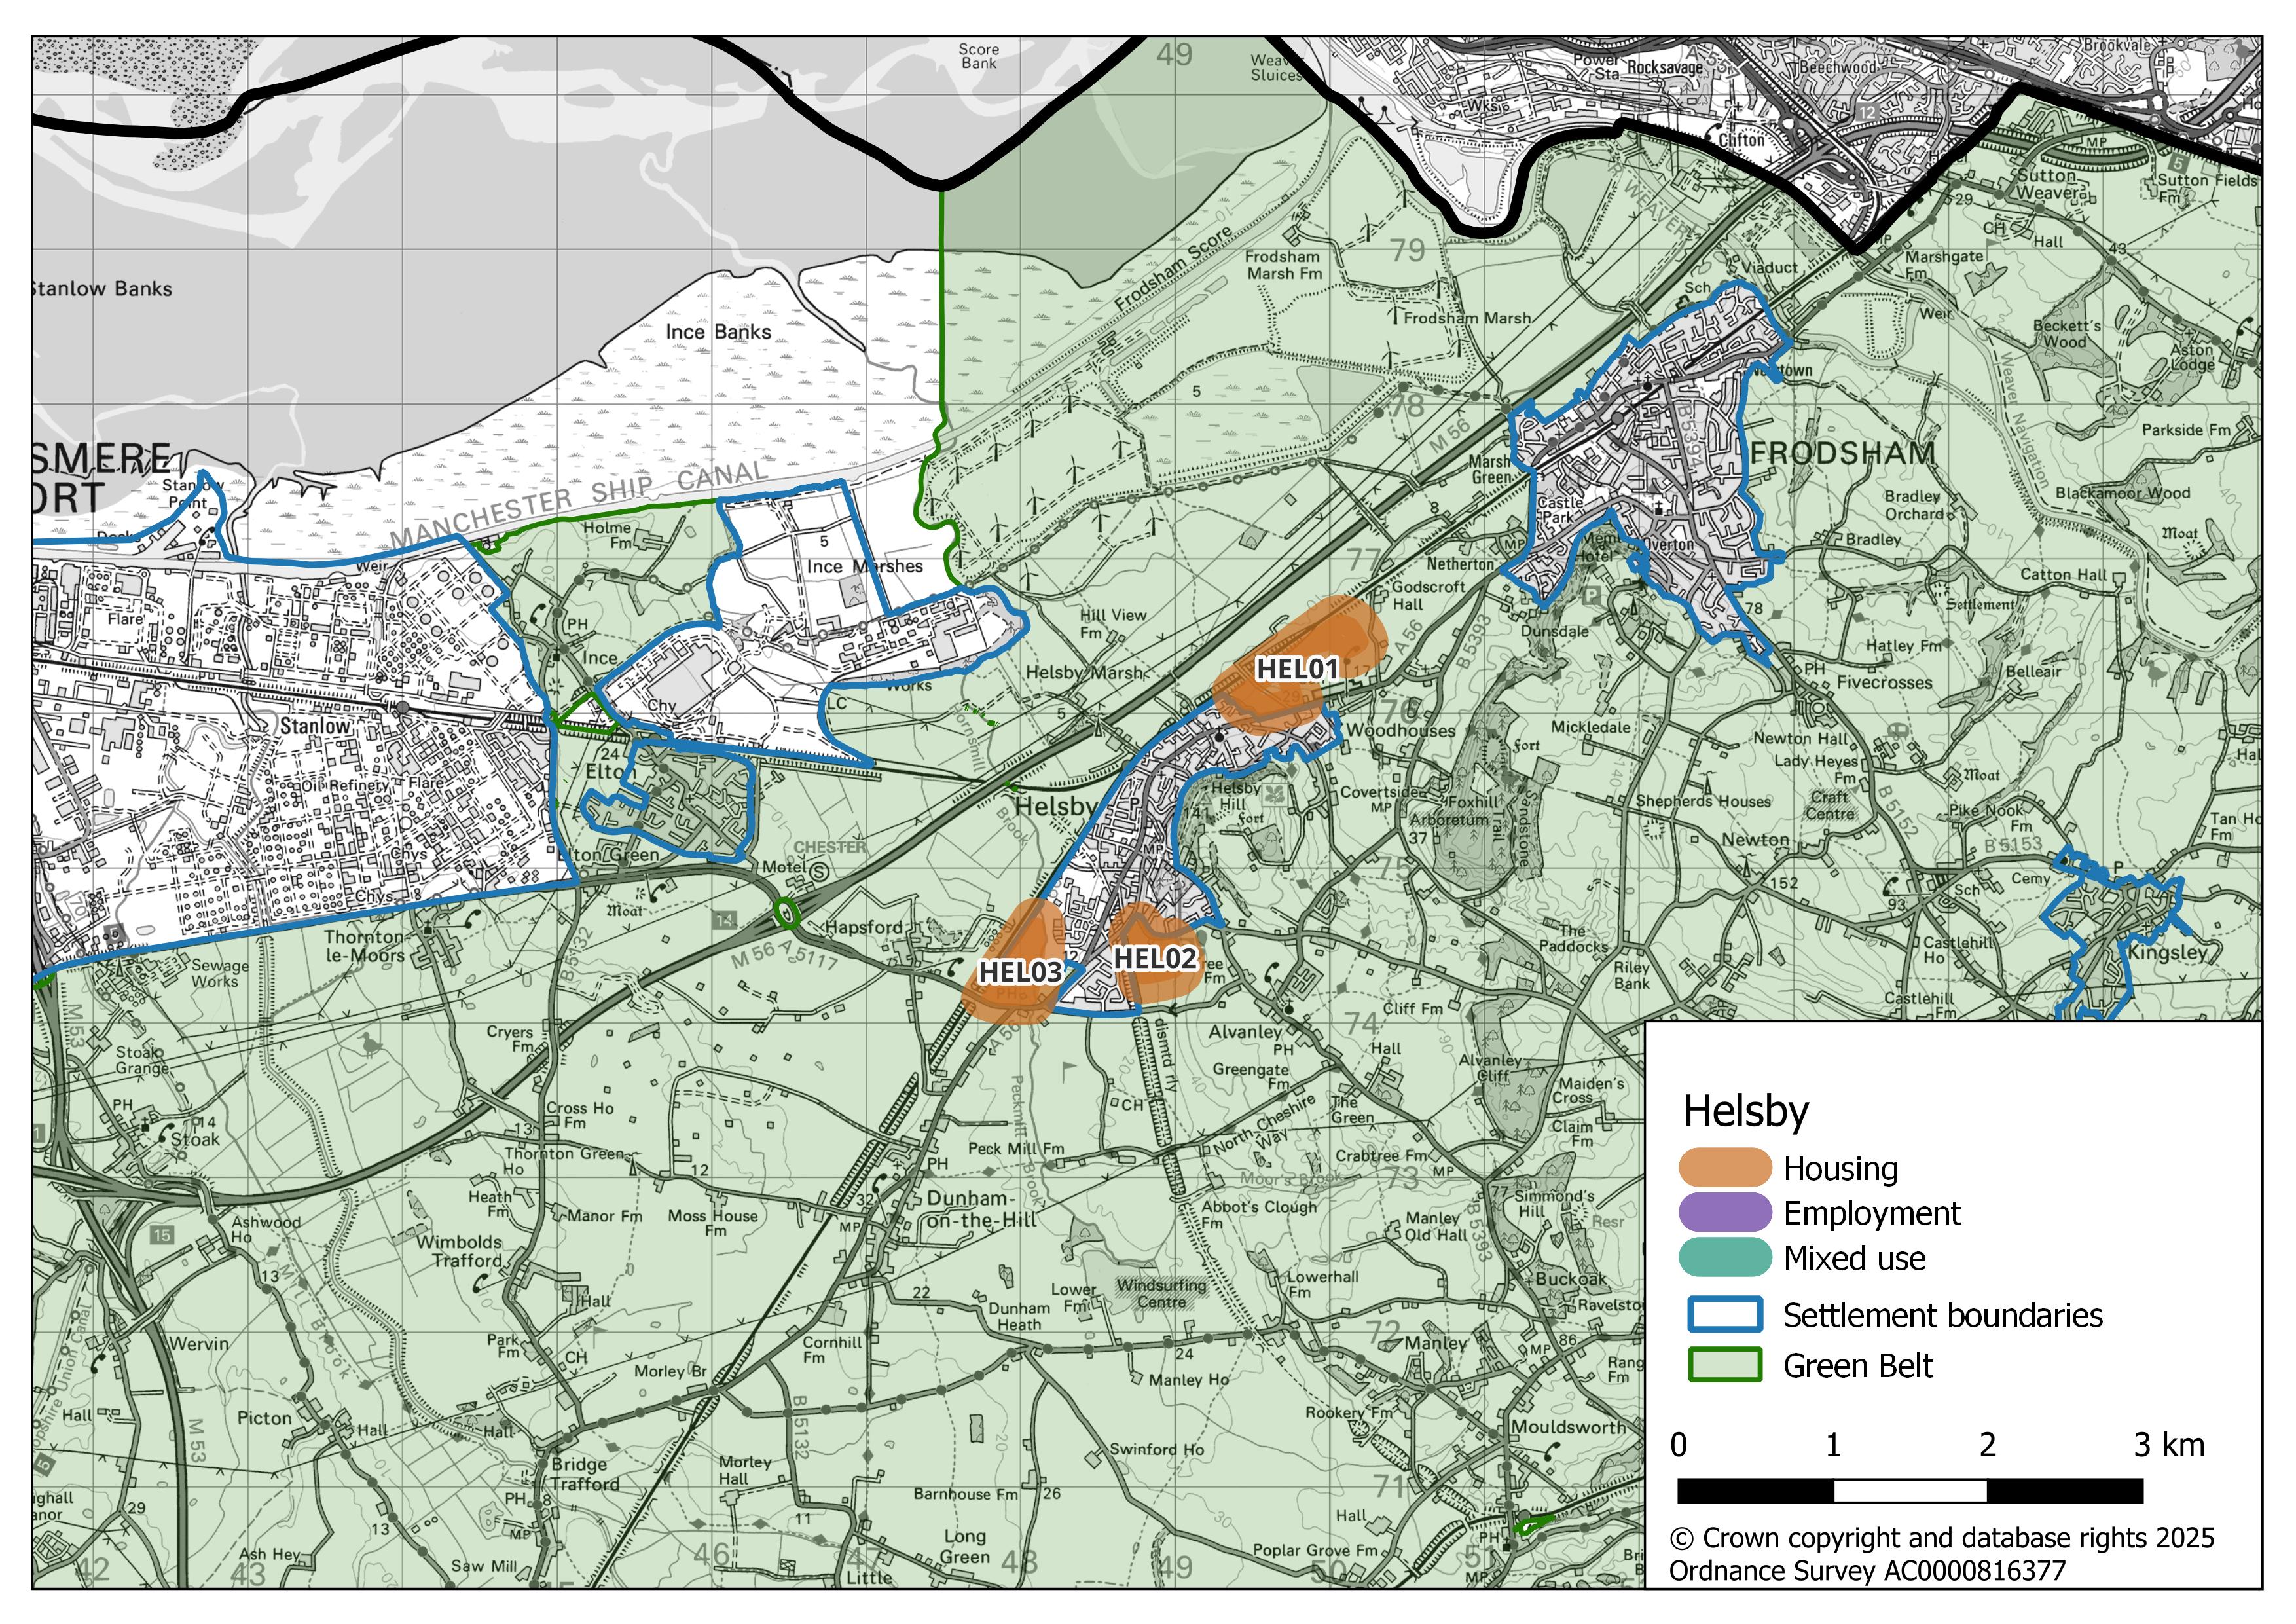
Which of the identified potential growth areas around Helsby do you consider to be the most suitable?
Question SS 45
Do you have any further comments about any of the potential growth areas identified around Helsby?
Question SS 46
Are there any constraints, including infrastructure provision, that should be considered for Helsby when developing the new Local Plan?
Question SS 47
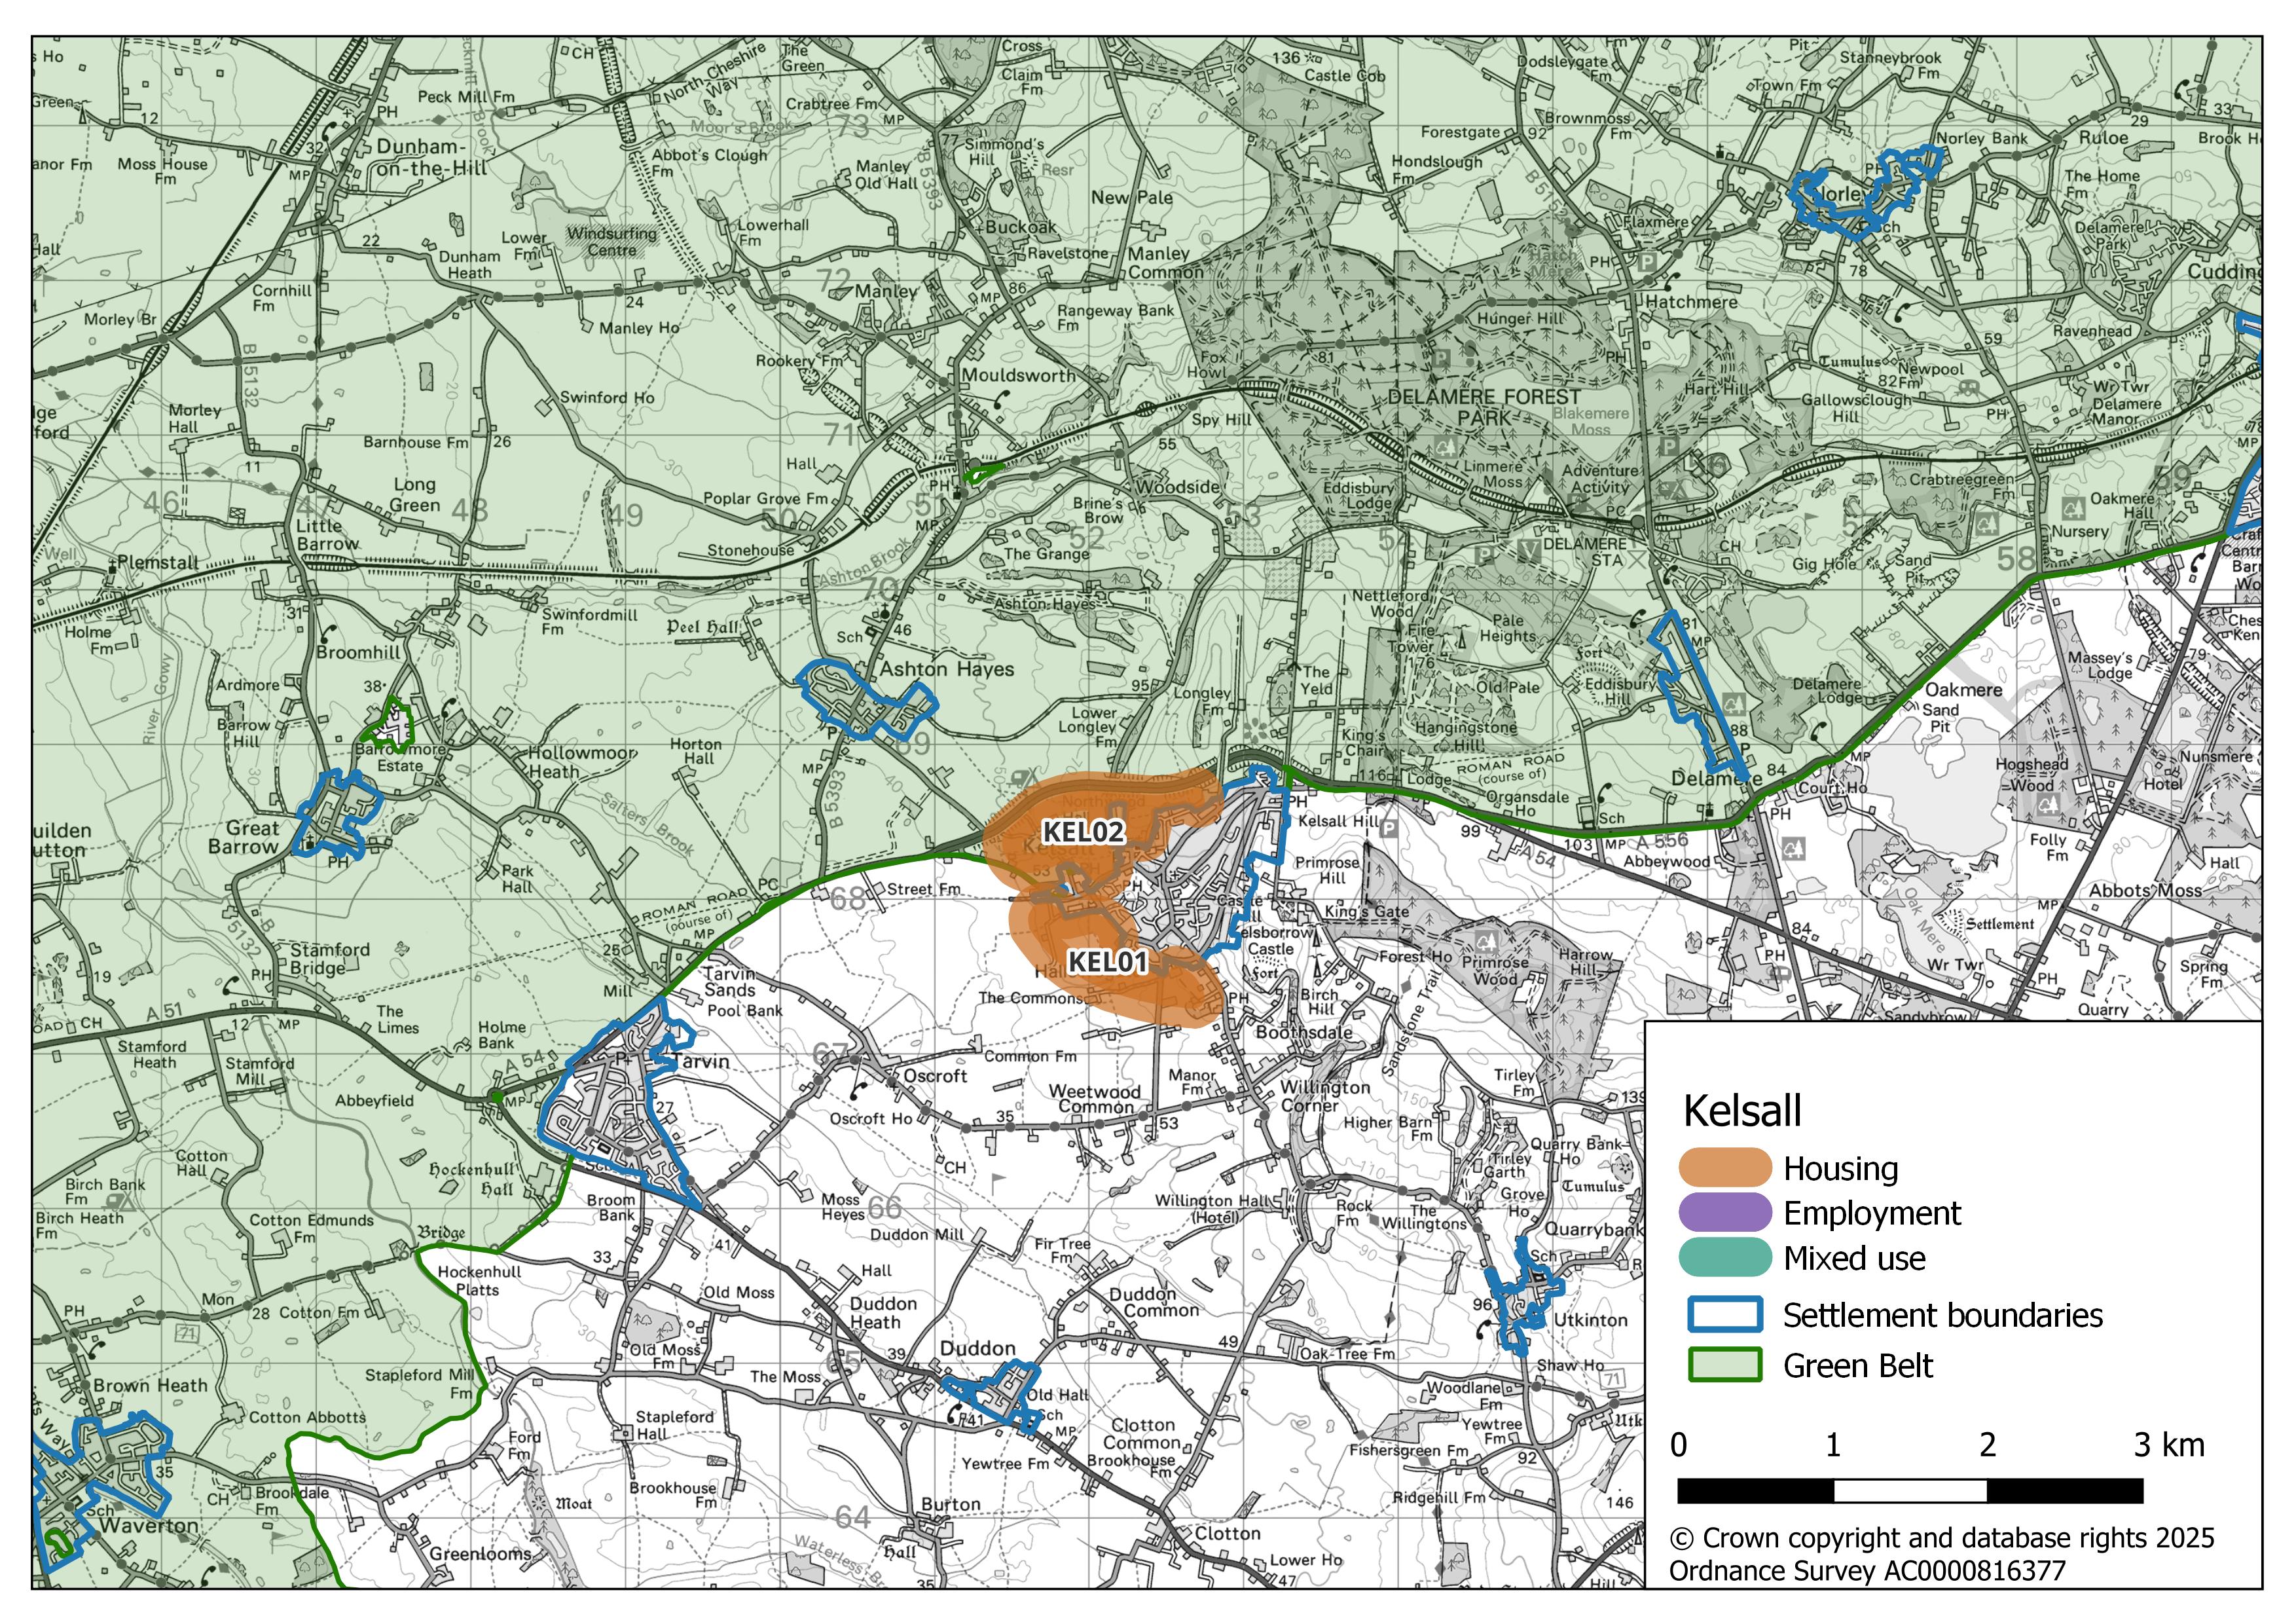
Which of the identified potential growth areas around Kelsall do you consider to be the most suitable?
Question SS 48
Do you have any further comments about any of the potential growth areas identified around Kelsall?
Question SS 49
Are there any constraints, including infrastructure provision, that should be considered for Kelsall when developing the new Local Plan?
Question SS 50
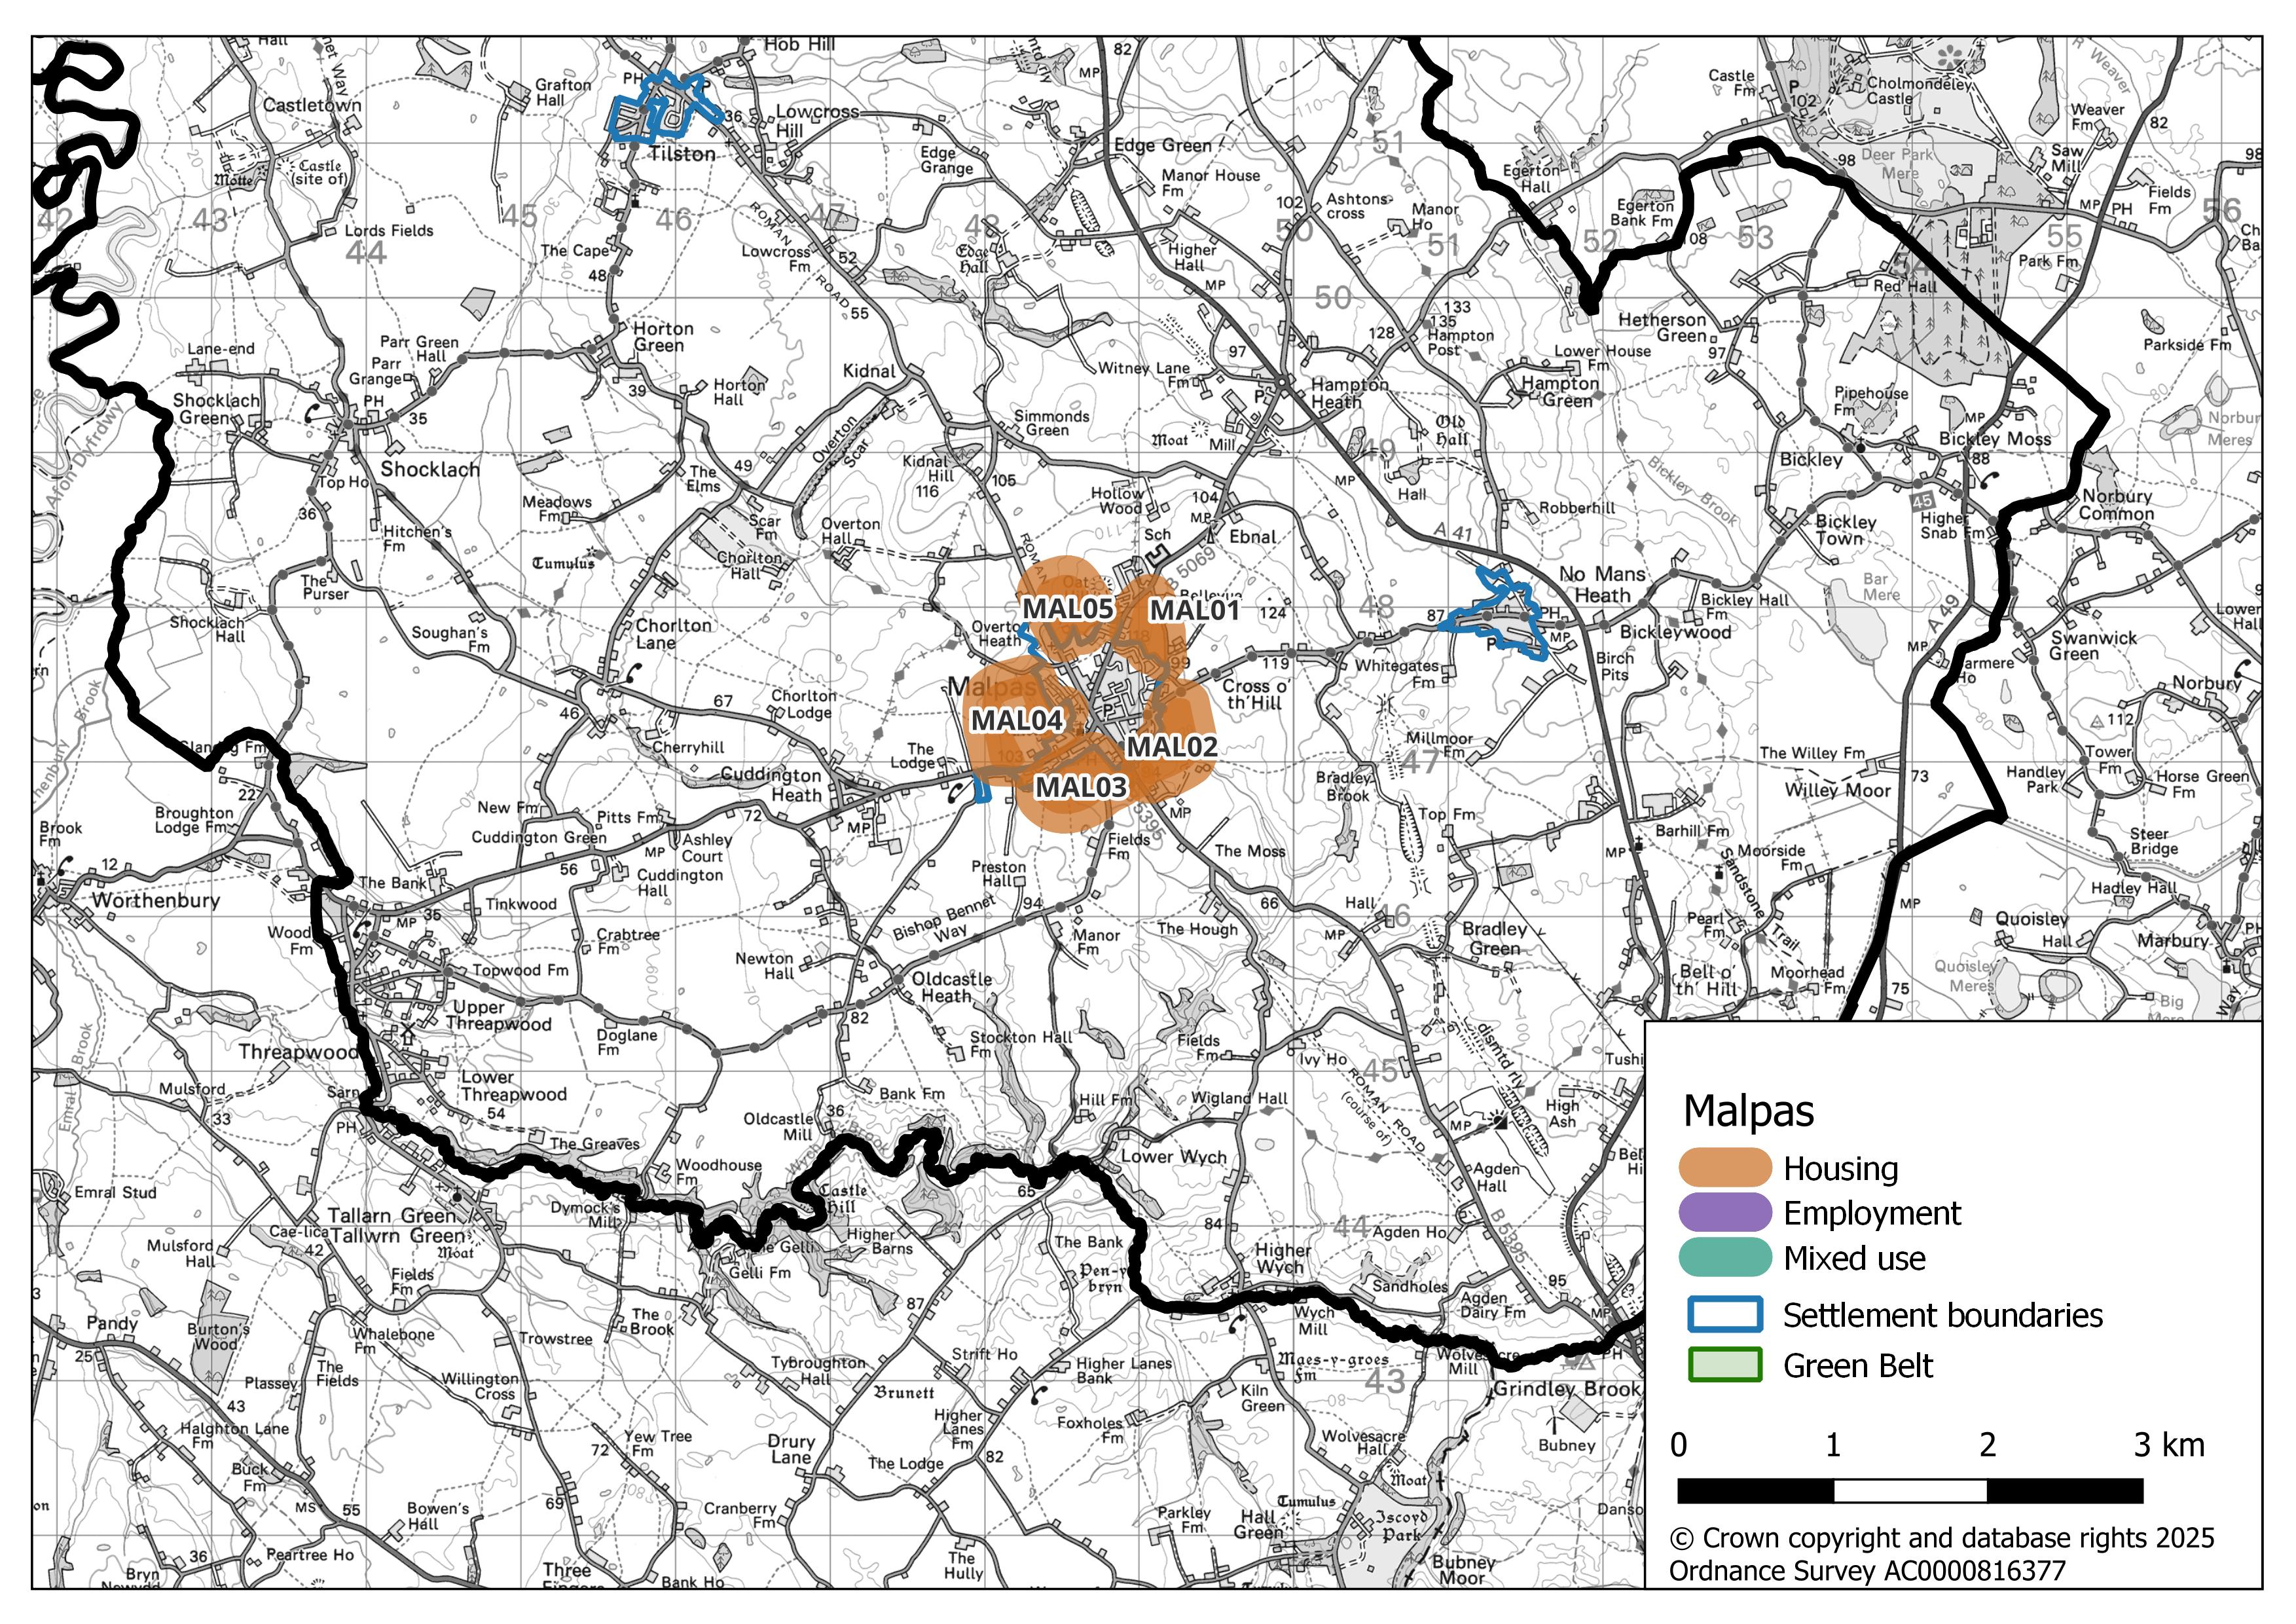
Which of the identified potential growth areas around Malpas do you consider to be the most suitable?
Question SS 51
Do you have any further comments about any of the potential growth areas identified around Malpas?
Question SS 52
Are there any constraints, including infrastructure provision, that should be considered for Malpas when developing the new Local Plan?
Question SS 53
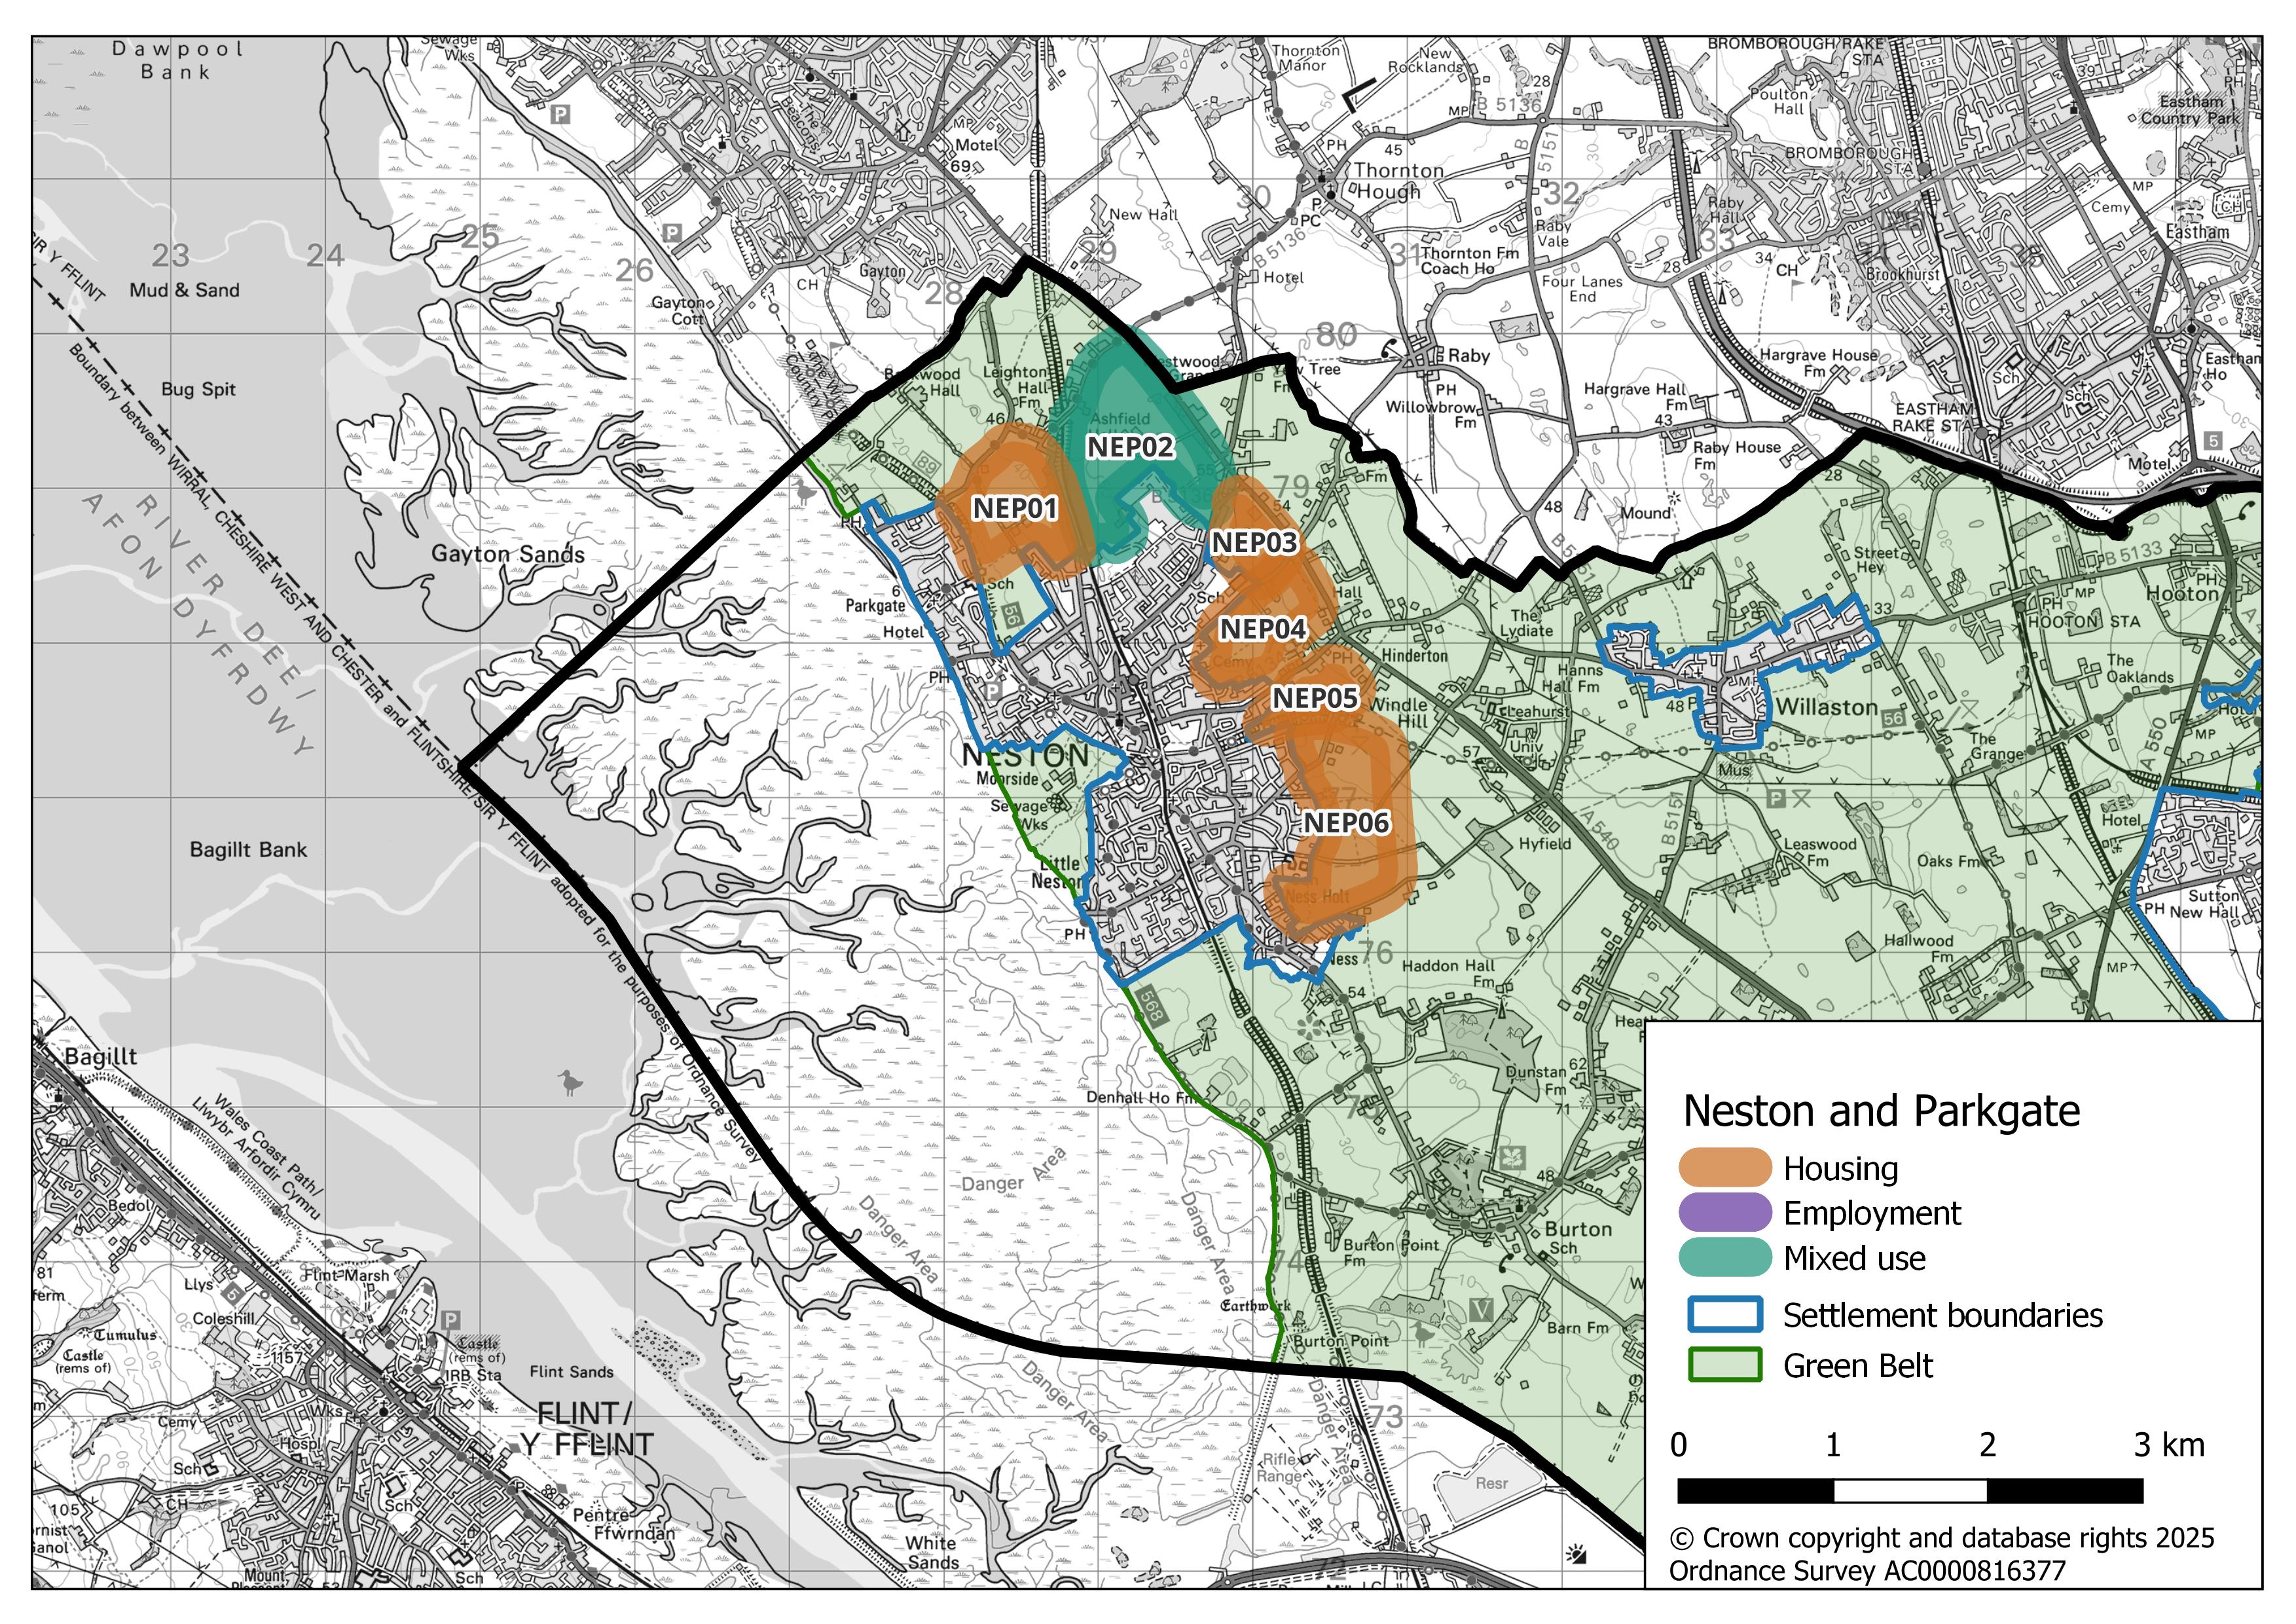
Which of the identified potential growth areas around Neston and Parkgate do you consider to be the most suitable?
Question SS 54
Do you have any further comments about any of the potential growth areas identified around Neston and Parkgate?
Question SS 55
Are there any constraints, including infrastructure provision, that should be considered for Neston and Parkgate when developing the new Local Plan?
Question SS 56
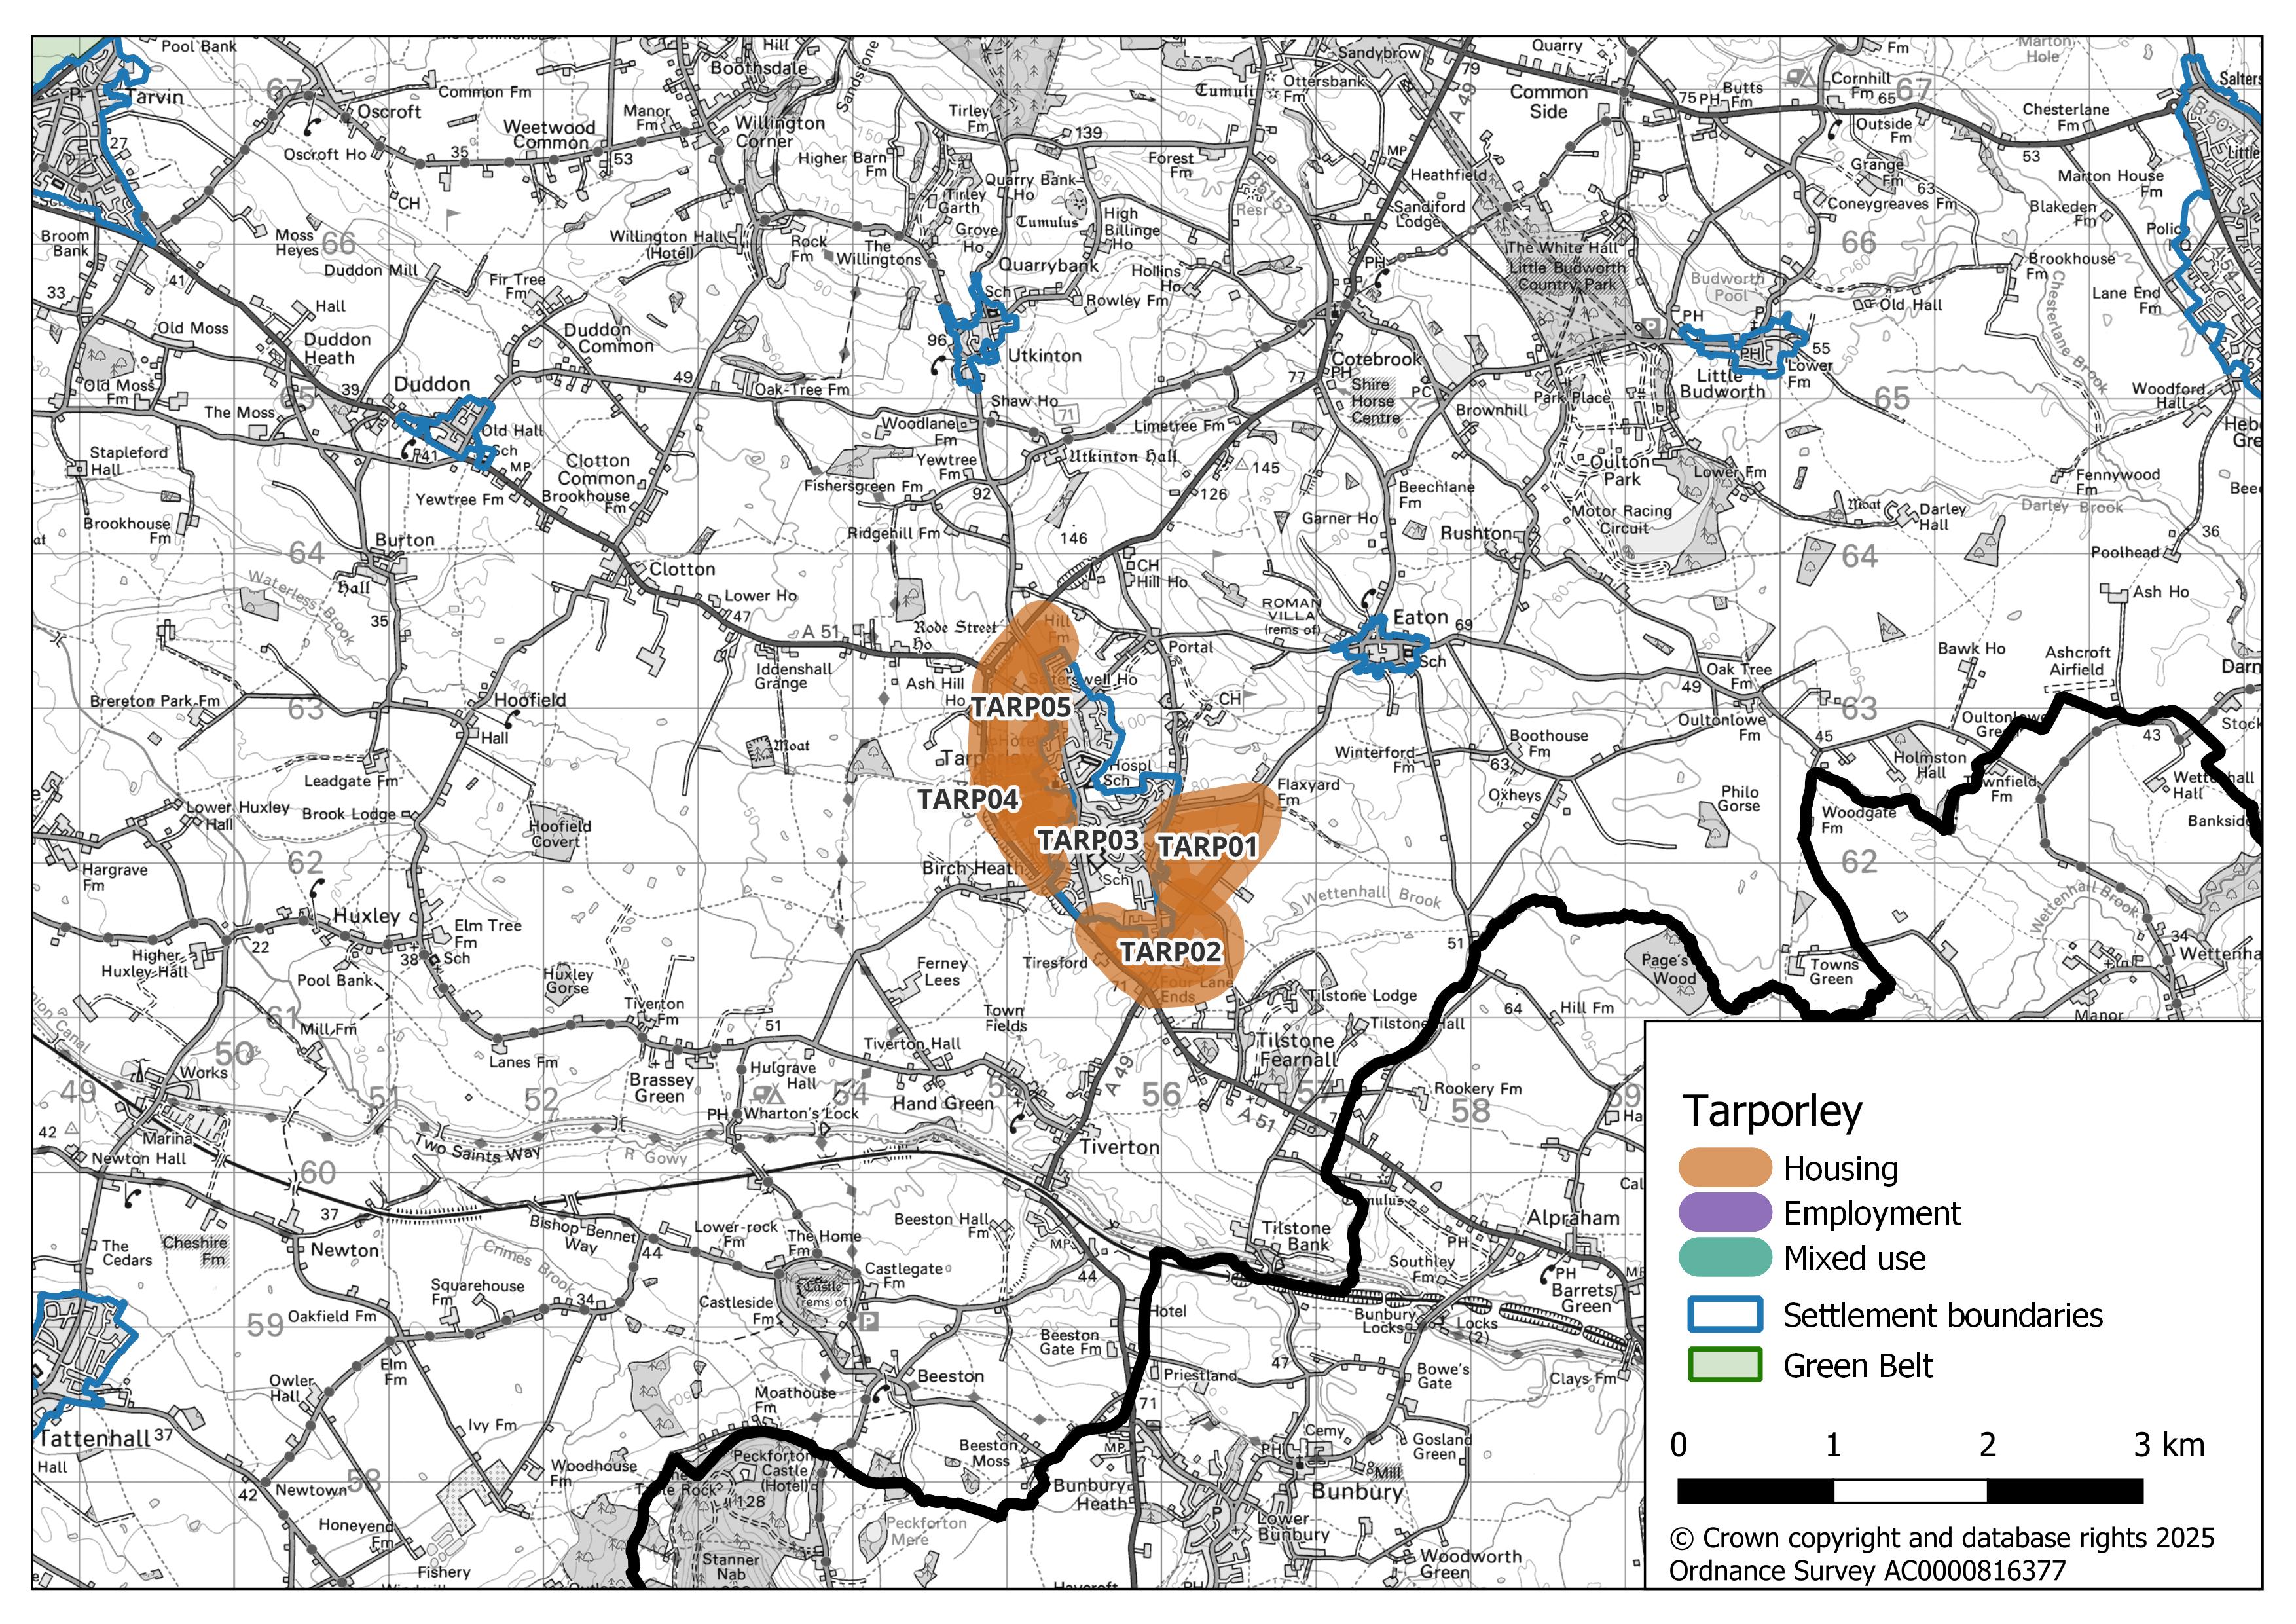
Which of the identified potential growth areas around Tarporley do you consider to be the most suitable?
Question SS 57
Do you have any further comments about any of the potential growth areas identified around Tarporley?
Question SS 58
Are there any constraints, including infrastructure provision, that should be considered for Tarporley when developing the new Local Plan?
Question SS 59
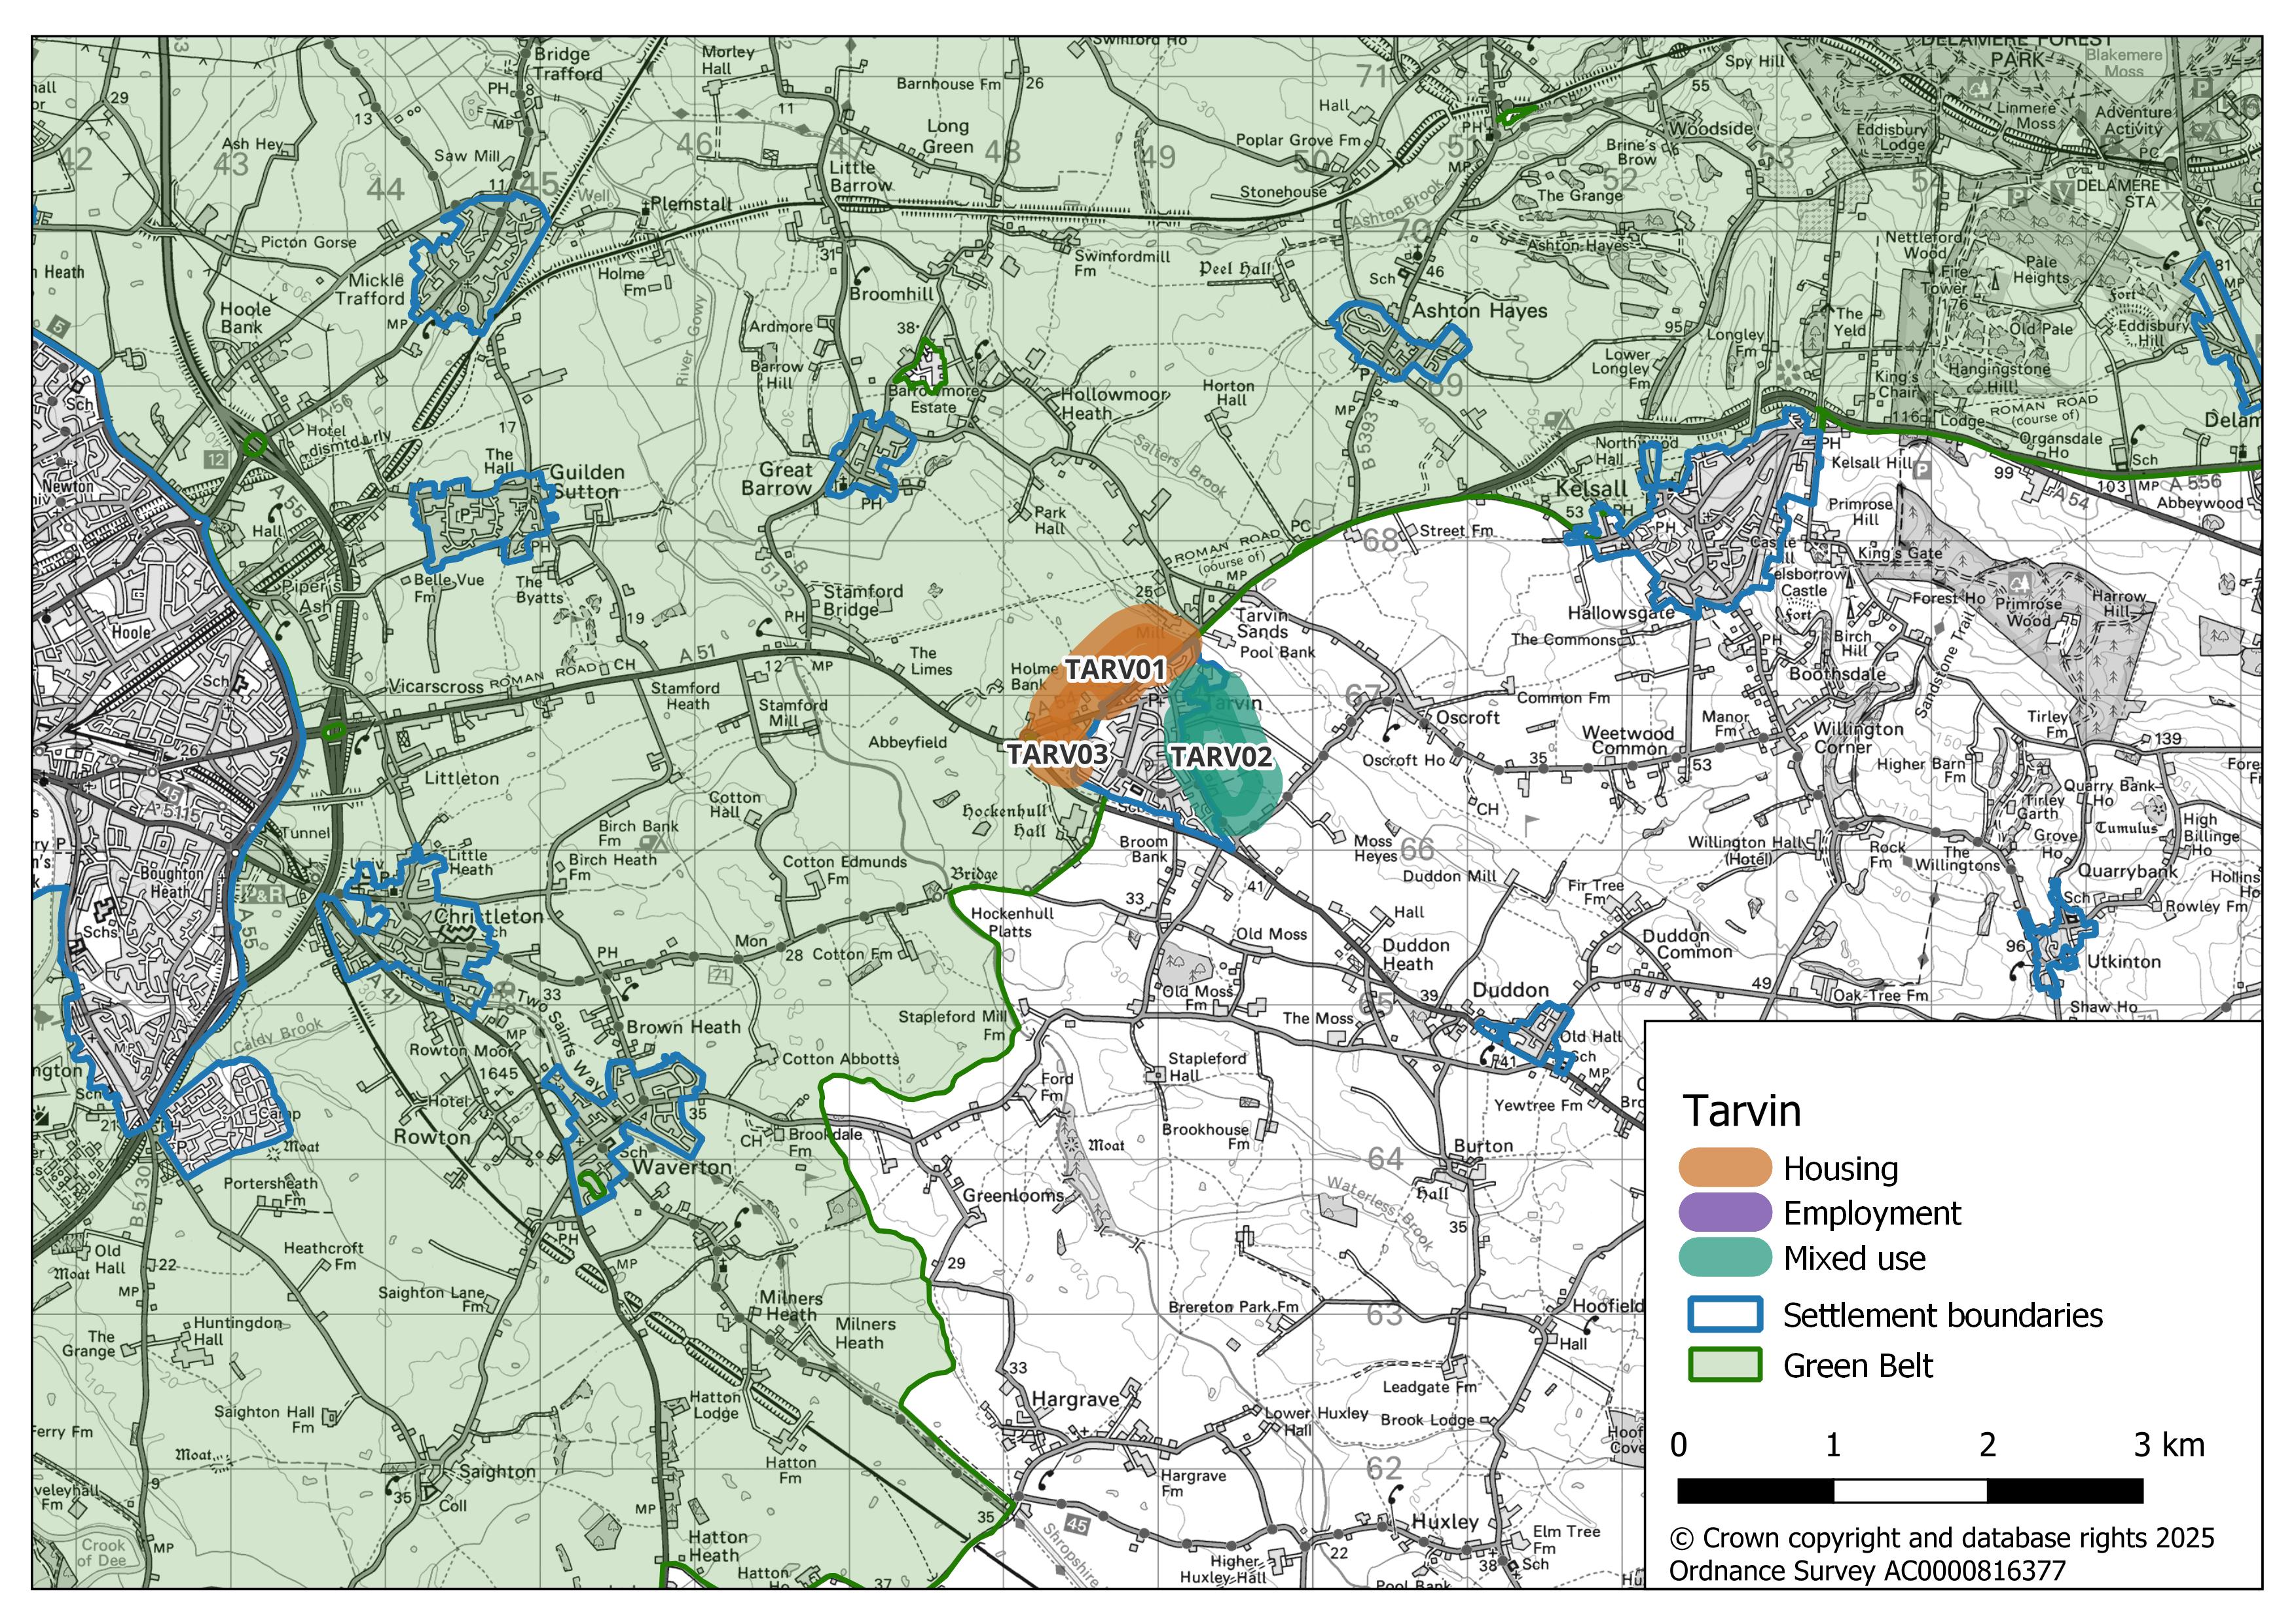
Which of the identified potential growth areas around Tarvin do you consider to be the most suitable?
Question SS 60
Do you have any further comments about any of the potential growth areas identified around Tarvin?
Question SS 61
Are there any constraints, including infrastructure provision, that should be considered for Tarvin when developing the new Local Plan?
Question SS 62
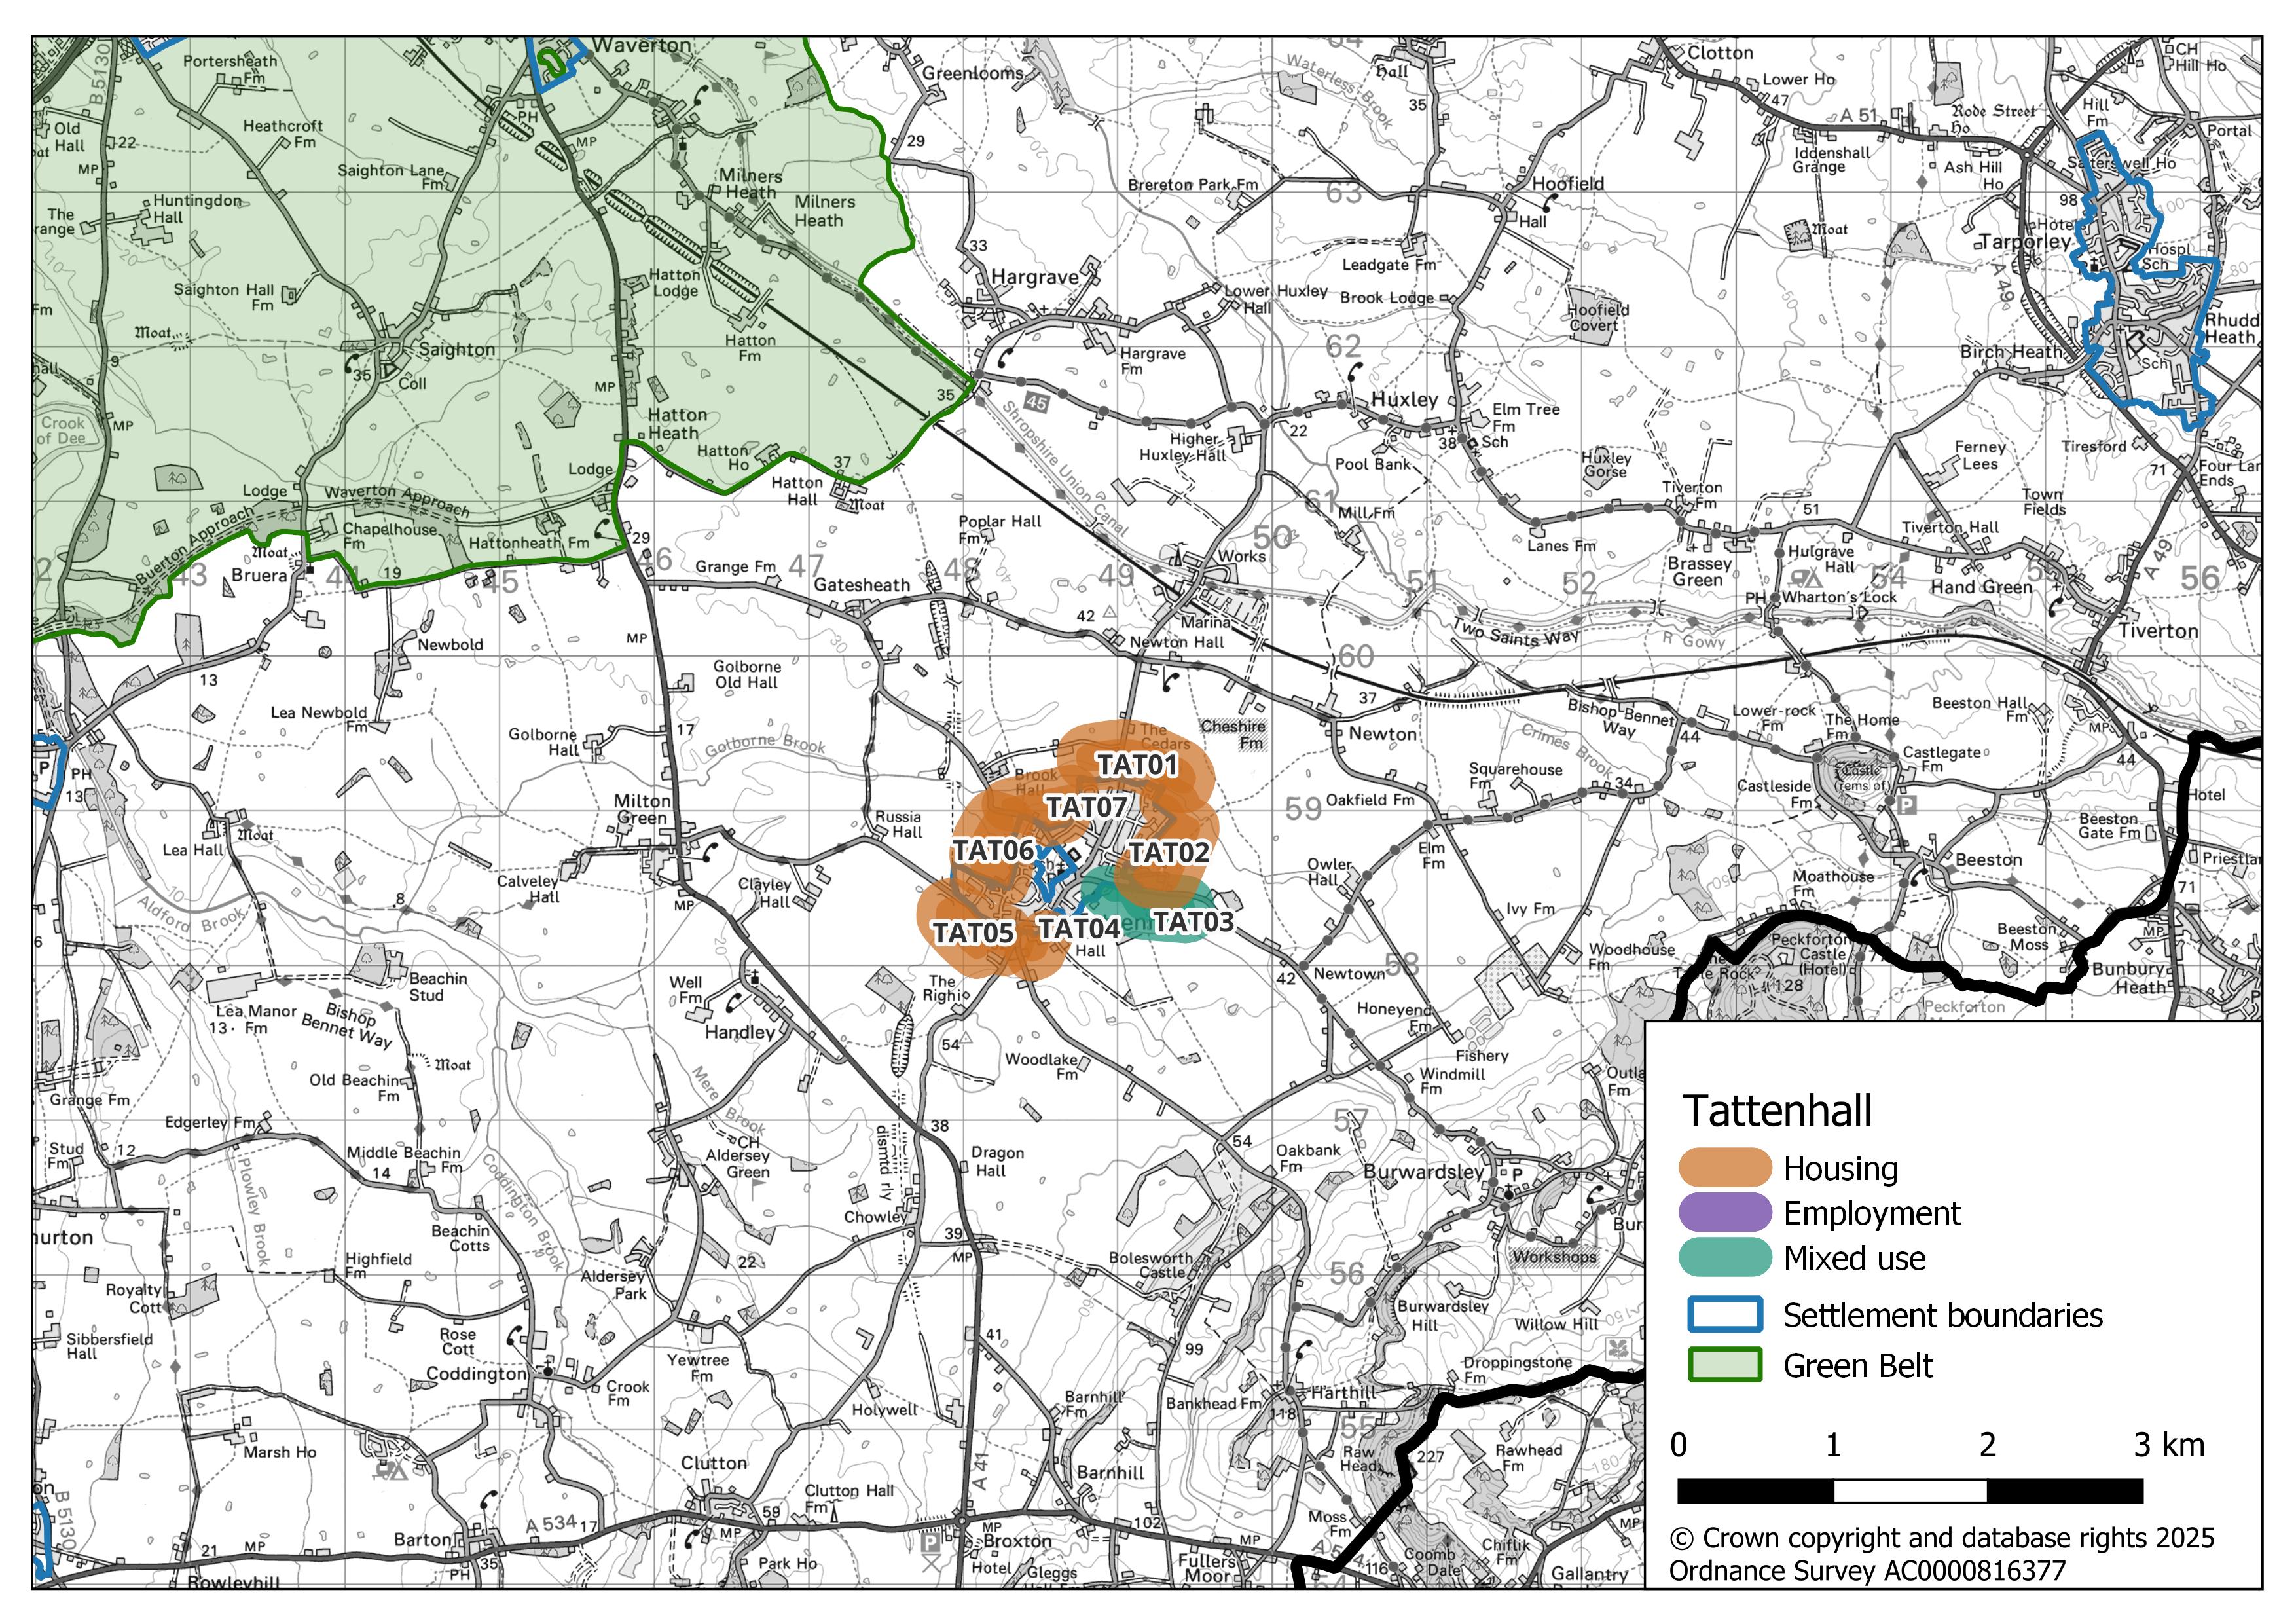
Which of the identified potential growth areas around Tattenhall do you consider to be the most suitable?
Question SS 63
Do you have any further comments about any of the potential growth areas identified around Tattenhall?
Question SS 64
Are there any constraints, including infrastructure provision, that should be considered for Tattenhall when developing the new Local Plan?
Question SS 65
Which of the identified potential growth areas around Acton Bridge station do you consider to be the most suitable?
Question SS 66
Do you have any further comments about any of the potential growth areas identified around Acton Bridge station?
Question SS 67
Are there any constraints, including infrastructure provision, that should be considered for the area around Acton Bridge station when developing the new Local Plan?
Question SS 68
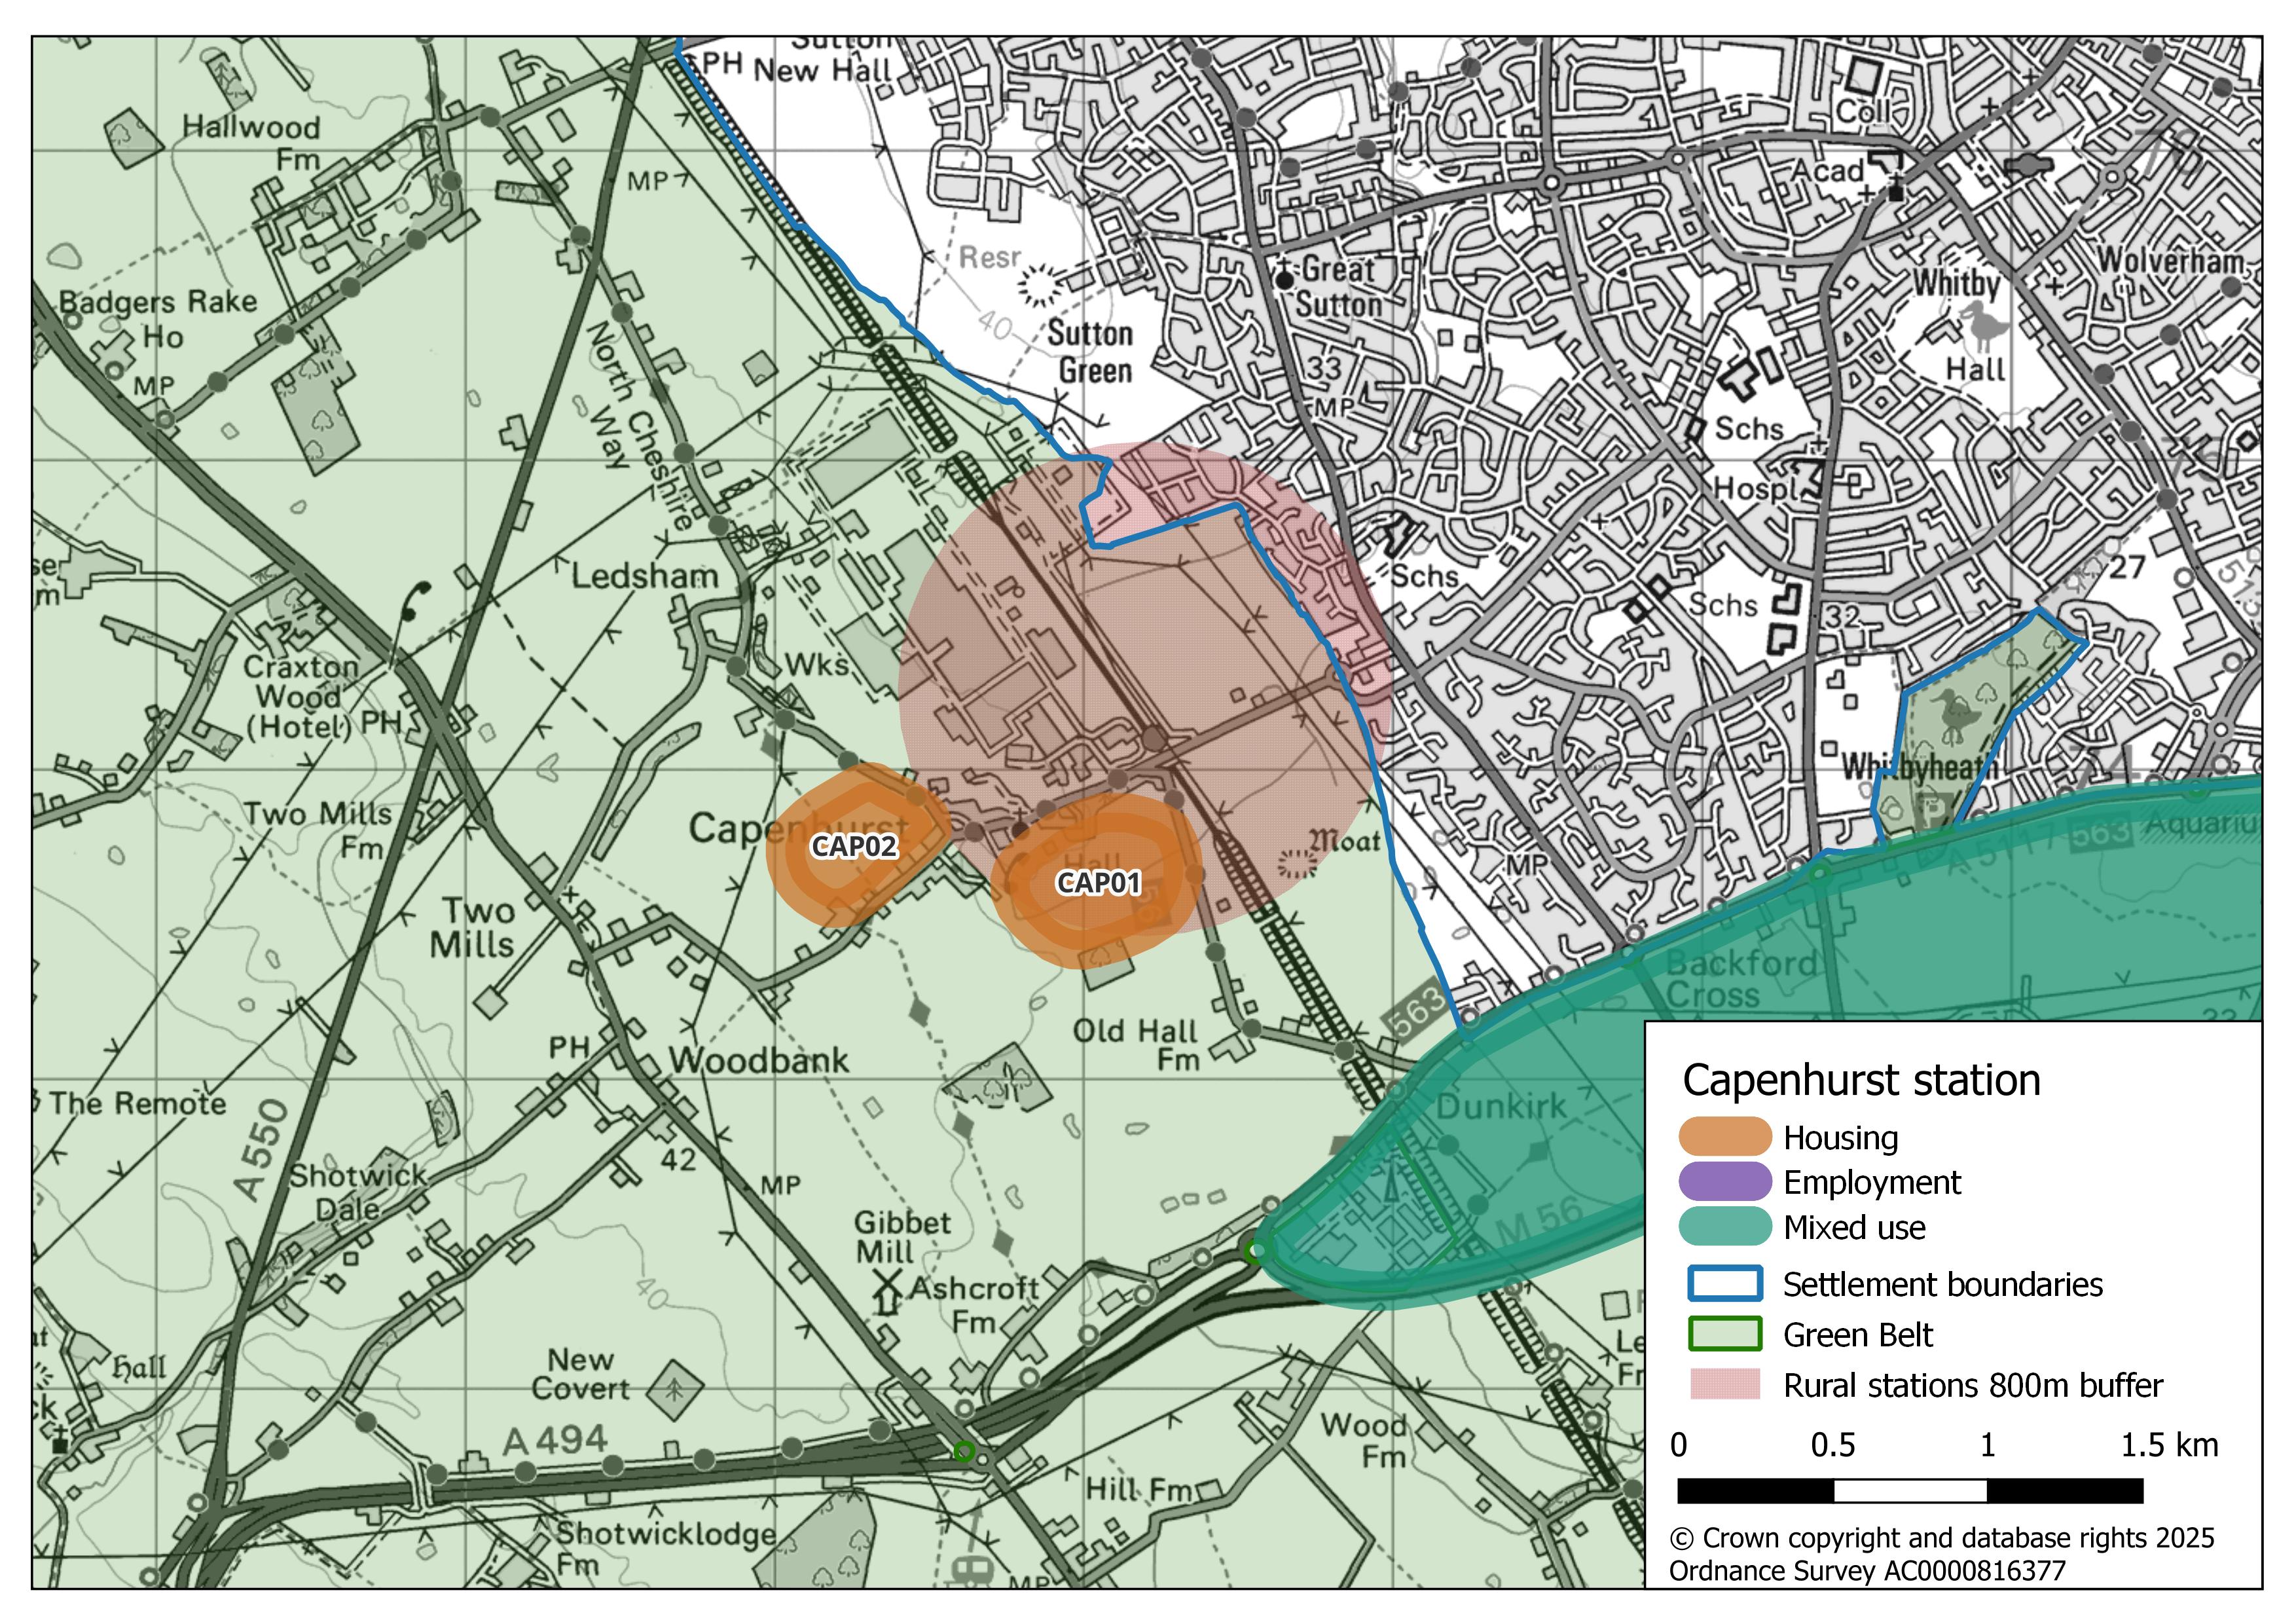
Which of the identified potential growth areas around Capenhurst station do you consider to be the most suitable?
Question SS 69
Do you have any further comments about any of the potential growth areas identified around Capenhurst station?
Question SS 70
Are there any constraints, including infrastructure provision, that should be considered for the area around Capenhurst station when developing the new Local Plan?
Question SS 71
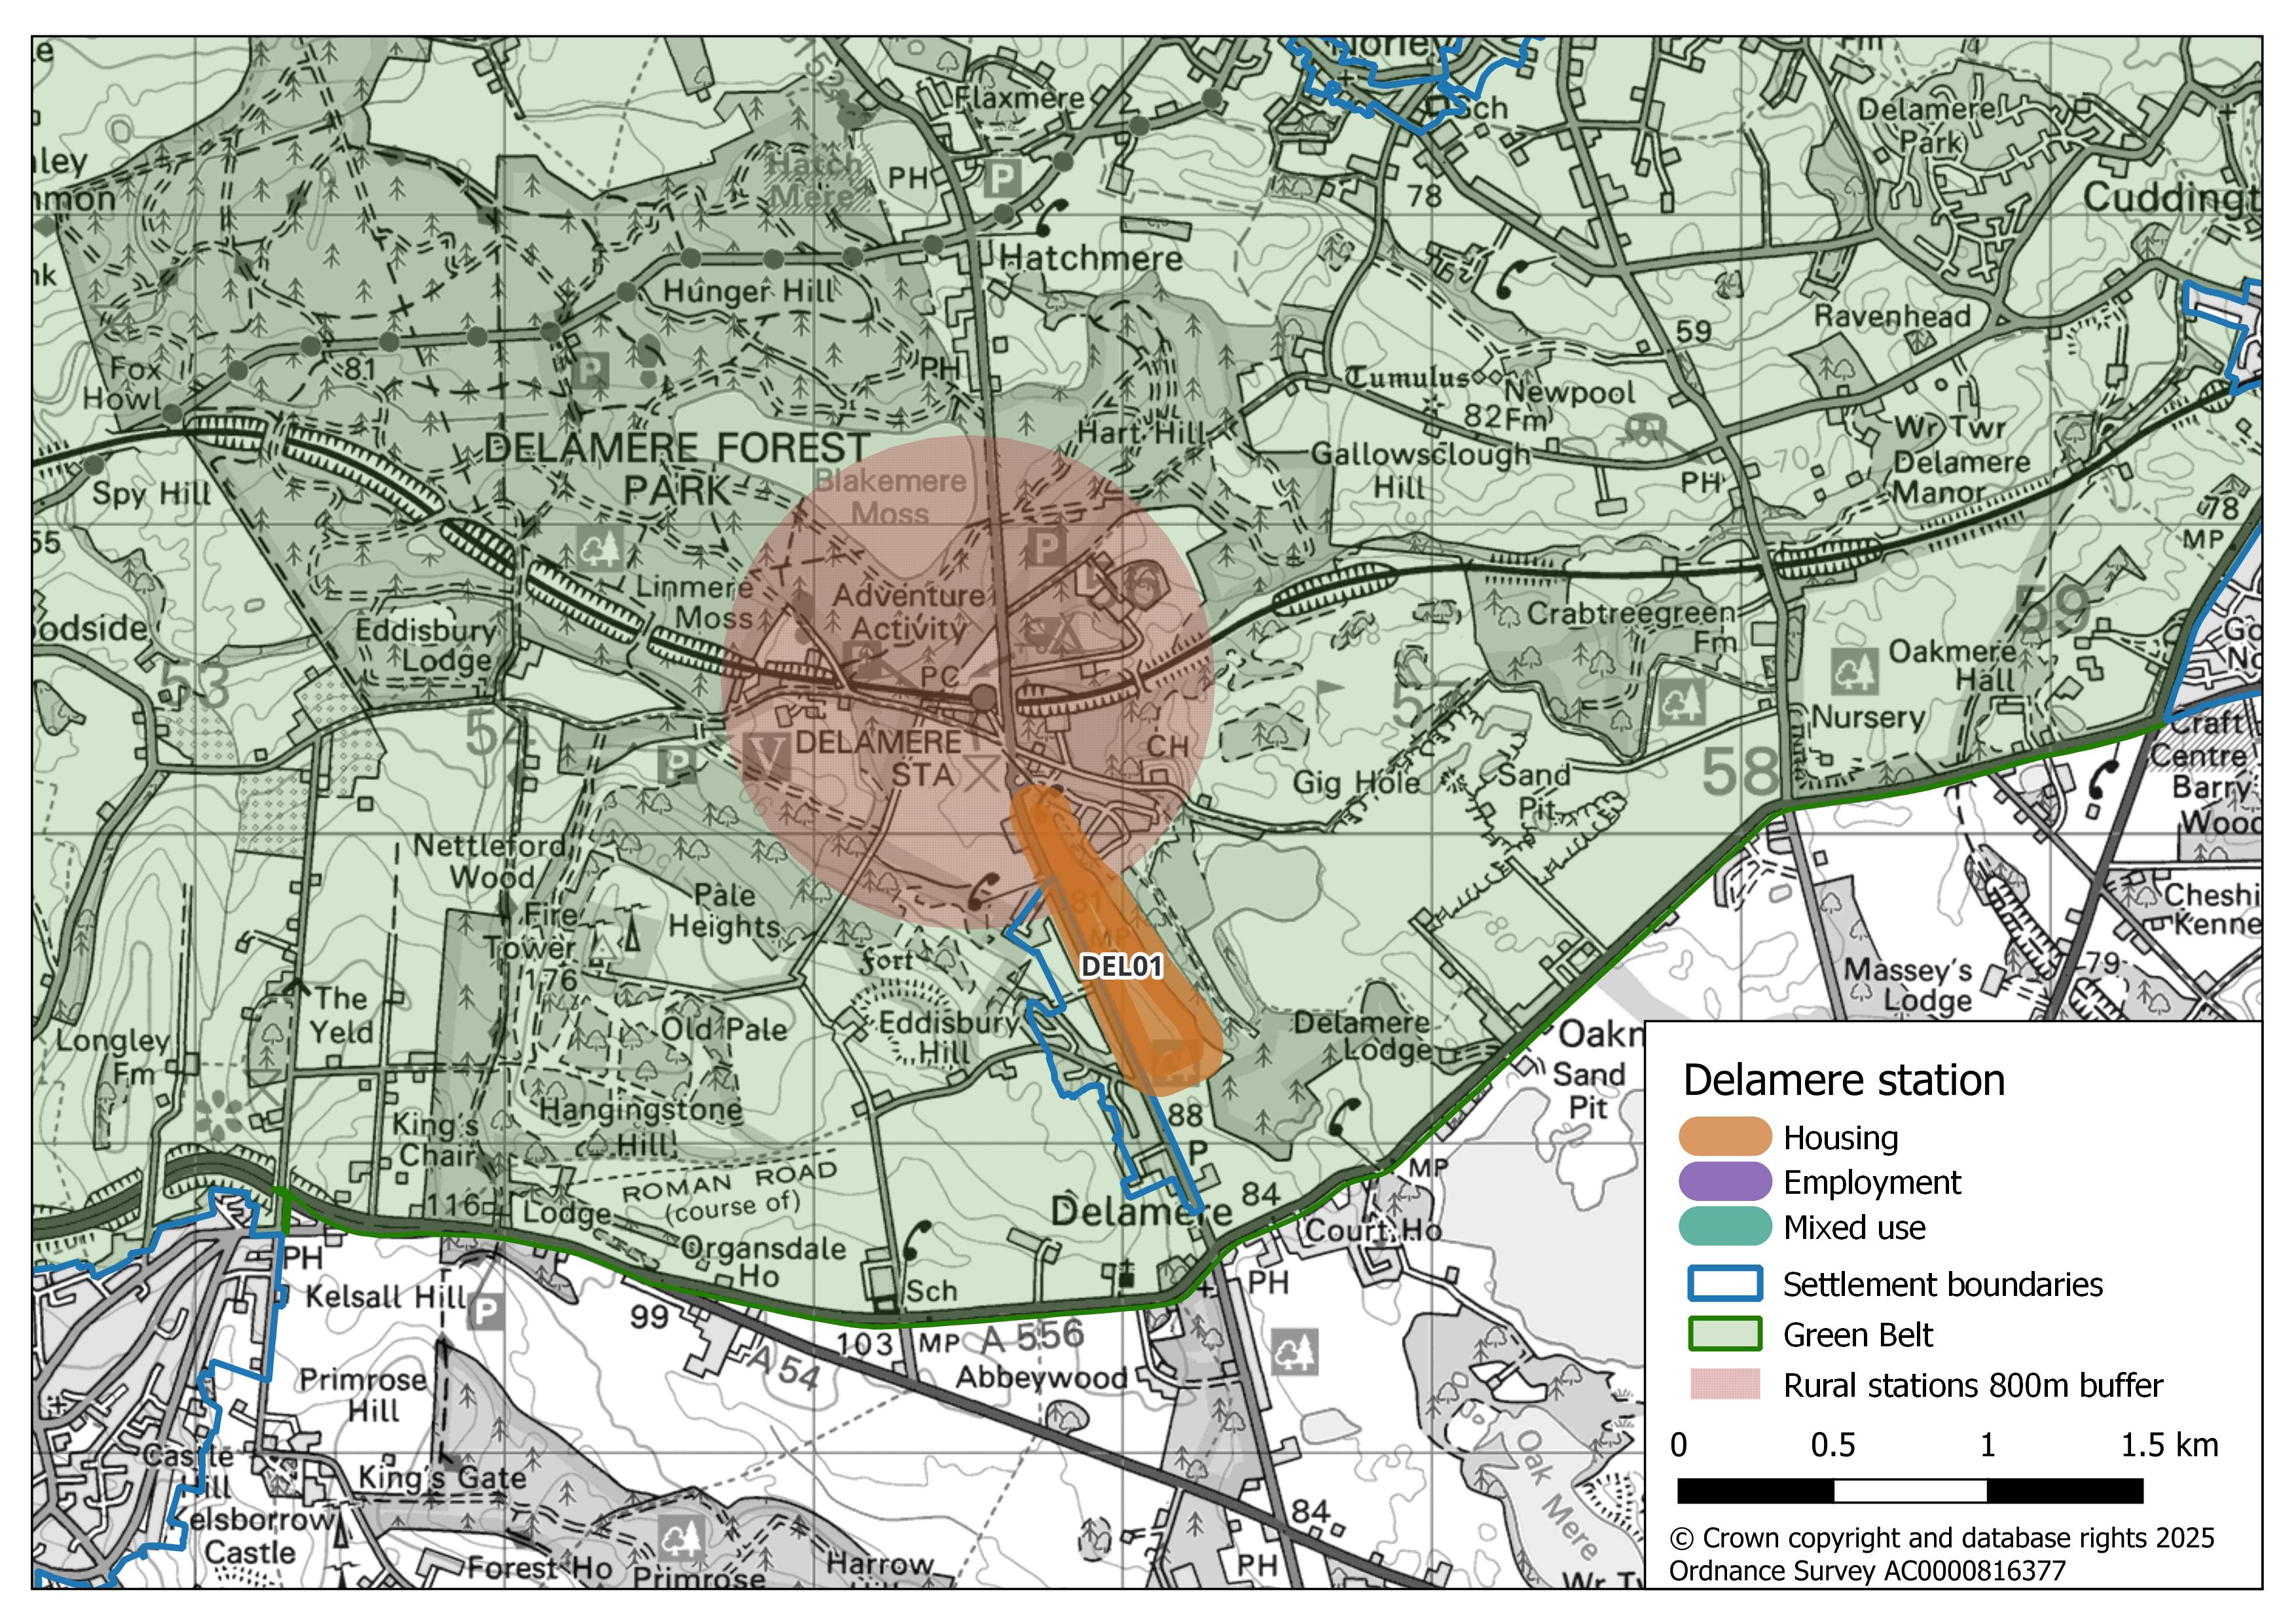
Which of the identified potential growth areas around Delamere station do you consider to be the most suitable?
Question SS 72
Do you have any further comments about any of the potential growth areas identified around Delamere station?
Question SS 73
Are there any constraints, including infrastructure provision, that should be considered for the area around Delamere station when developing the new Local Plan?
Question SS 74
Which of the identified potential growth areas around Elton station do you consider to be the most suitable?
Question SS 75
Do you have any further comments about any of the potential growth areas identified around Elton station?
Question SS 76
Are there any constraints, including infrastructure provision, that should be considered for the area around Elton station when developing the new Local Plan?
Question SS 77
Which of the identified potential growth areas around Hooton station do you consider to be the most suitable?
Question SS 78
Do you have any further comments about any of the potential growth areas identified around Hooton station?
Question SS 79
Are there any constraints, including infrastructure provision, that should be considered for the area around Hooton station when developing the new Local Plan?
Question SS 80
Which of the identified potential growth areas around Lostock Gralam station do you consider to be the most suitable?
Question SS 81
Do you have any further comments about any of the potential growth areas identified around Lostock Gralam station?
Question SS 82
Are there any constraints, including infrastructure provision, that should be considered for the area around Lostock Gralam station when developing the new Local Plan?
Question SS 83
Which of the identified potential growth areas around Mouldsworth station do you consider to be the most suitable?
Question SS 84
Do you have any further comments about any of the potential growth areas identified around Mouldsworth station?
Question SS 85
Are there any constraints, including infrastructure provision, that should be considered for the area around Mouldsworth station when developing the new Local Plan?