F Housing trajectory
| YEAR | 10/11 | 11/12 | 12/13 | 13/14 | 14/15 | 15/16 | 16/17 | 17/18 | 18/19 | 19/20 | 20/21 | 21/22 | 22/23 | 23/24 | 24/25 | 25/26 | 26/27 | 27/28 | 28/29 | 29/30 | Total |
|---|---|---|---|---|---|---|---|---|---|---|---|---|---|---|---|---|---|---|---|---|---|
| Past Completions | 654 | 803 | 673 | 970 | 3,100 | ||||||||||||||||
| Commitments1 | 1,422 | 1,560 | 1,552 | 1,632 | 1,548 | 1,174 | 991 | 859 | 763 | 642 | 425 | 380 | 350 | 264 | 0 | 0 | 13,562 | ||||
| Small site allowance2 | 0 | 0 | 0 | 150 | 150 | 150 | 150 | 150 | 150 | 150 | 150 | 150 | 150 | 150 | 150 | 150 | 1,950 | ||||
| Strategic Sites3 | 0 | 0 | 28 | 119 | 131 | 131 | 131 | 131 | 131 | 131 | 206 | 206 | 181 | 171 | 171 | 171 | 2,039 | ||||
| SHLAA4 | 0 | 0 | 122 | 245 | 247 | 0 | 0 | 0 | 0 | 0 | 0 | 0 | 0 | 0 | 0 | 0 | 614 | ||||
| Additional dwellings to be planned | 0 | 0 | 0 | 0 | 0 | 0 | 0 | 0 | 0 | 0 | 0 | 0 | 0 | 100 | 318 | 317 | 735 | ||||
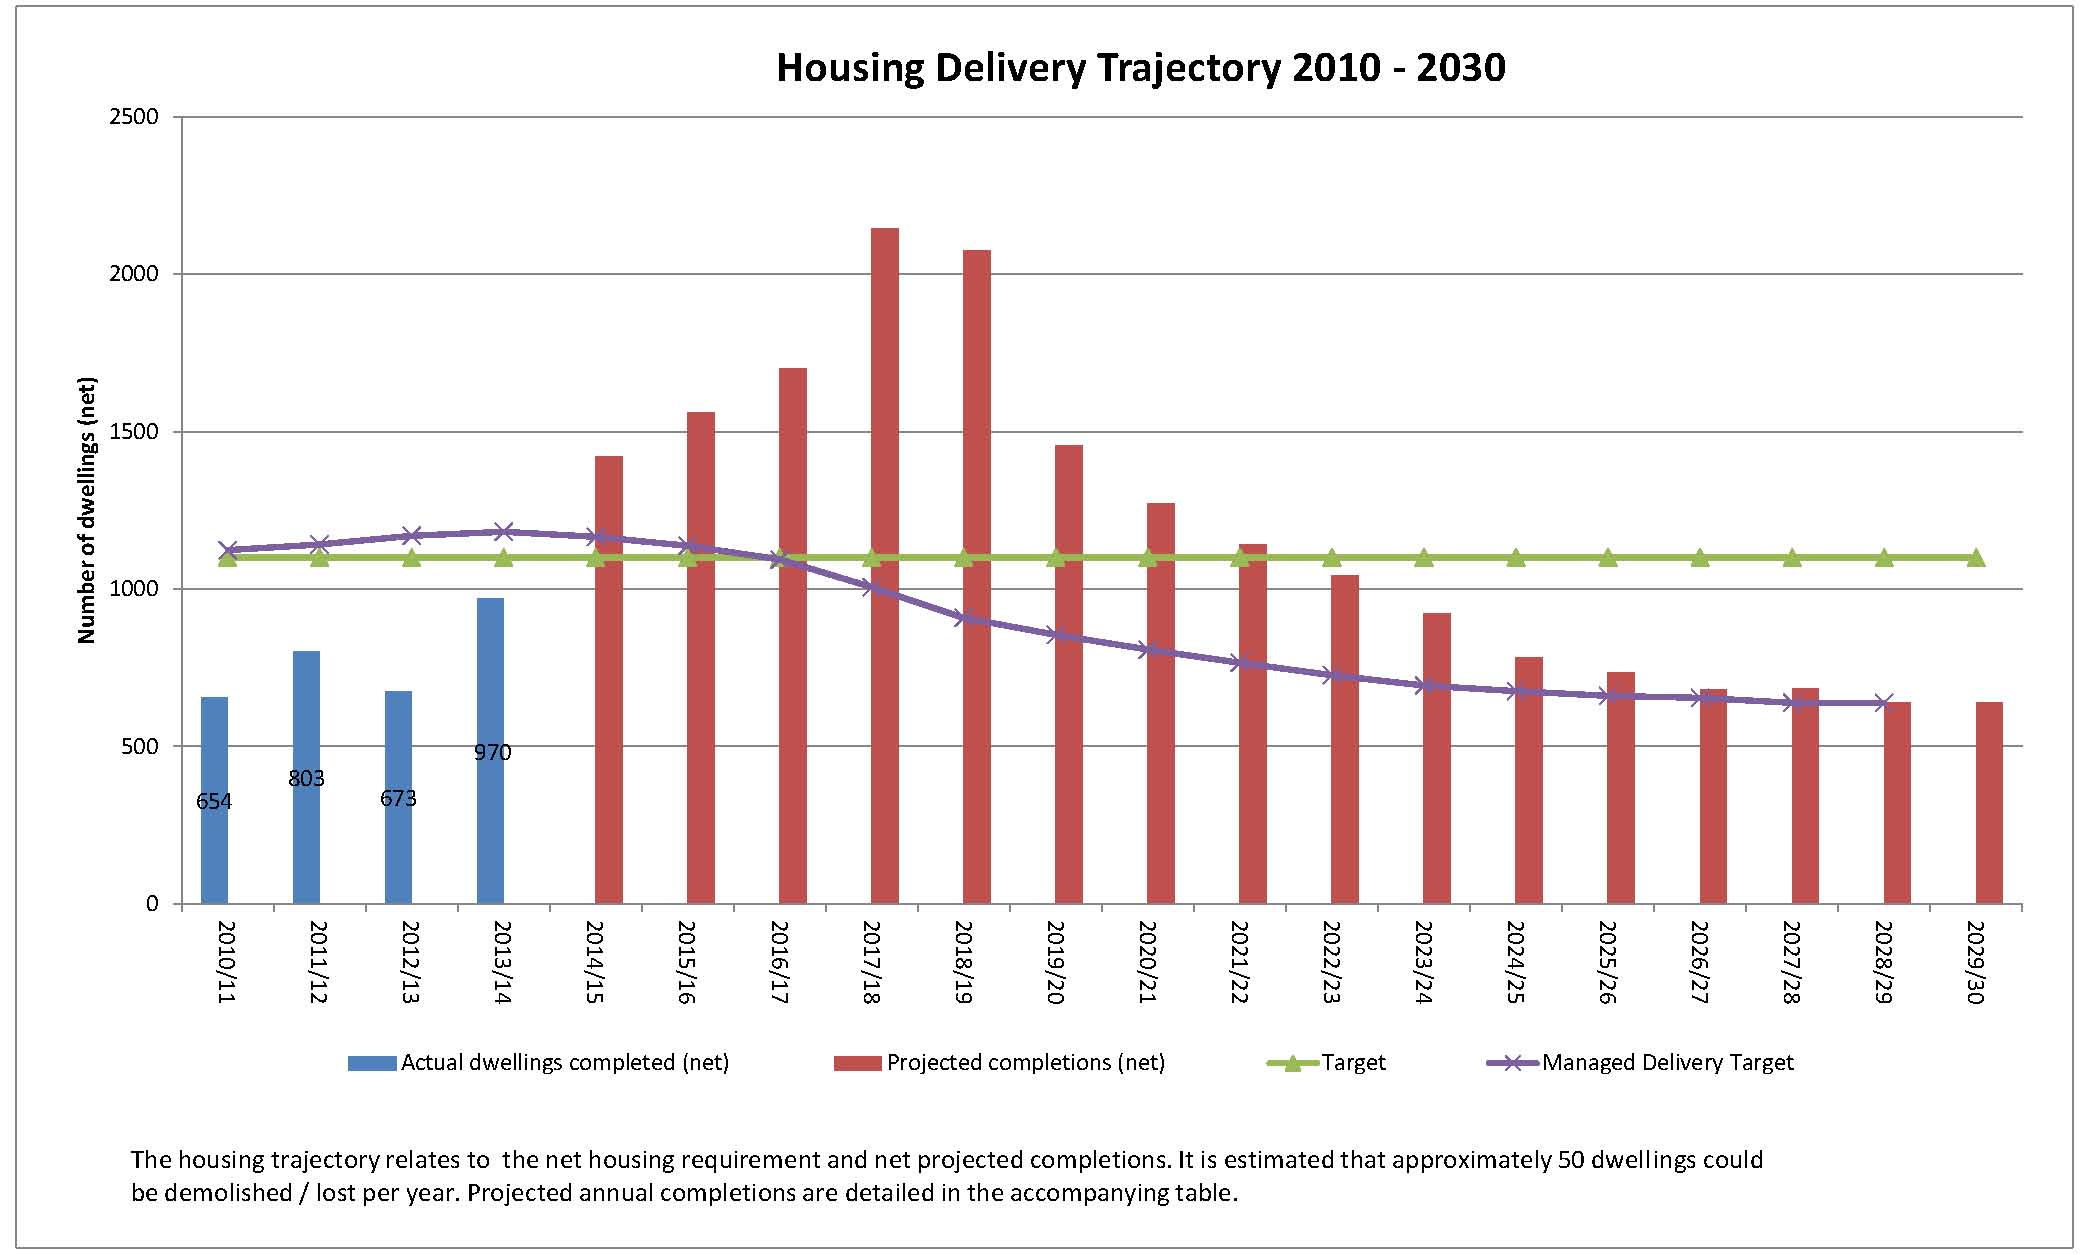
| Total completions | 654 | 803 | 673 | 970 | 1,422 | 1,560 | 1,702 | 2,146 | 2,076 | 1,455 | 1,272 | 1,140 | 1,044 | 923 | 781 | 736 | 681 | 685 | 639 | 638 | 22,000 |
|
The table shows the annual projected net completions by individual source for the Plan period (2010 - 2030). The residual requirement when completions and commitments are taken into account is 735 dwellings. The identified supply from SHLAA (beyond the first five years) is 4,653 dwellings, or 12,675 dwellings when including greenfield extensions. Average annual net requirement is 1,100 dwellings 1 Sites with extant planning permission, including sites subject to the signing of a s106 legal agreement 2 Sites below 0.4ha or sites having a yield of 9 or fewer 3 Sites identified in the Local Plan (Part One) Strategic Policies key to the delivery of the Plan currently without planning permission 4 Sites over 0.4ha or 10 dwellings which are not commitments but identified as deliverable/developable through the Strategic Housing Land Availability Assessment |
|||||||||||||||||||||