Call for Sites 2026
The 'Call for Sites' will be open between Wednesday 14 October and Friday 6 November 2026. This is an opportunity to tell us about any land/site for potential development that has not been submitted to us previously.

Chapter 7 of the NPPF supports building a strong, effective economy. The objective of this chapter is to enable businesses to invest, expand and adapt in a way that reflects the opportunities, challenges and characteristics of different areas, and supports long-term economic growth both locally and nationally.
Plan making policy E1 ‘Providing the conditions for long term economic growth’ says the Local Plan should encourage sustainable economic growth, set out a clear economic vision and strategy, which takes a positive, proactive and realistic approach to encouraging sustainable economic growth in both urban and rural areas. It should have regard to the Industrial Strategy and any relevant strategic and local strategies for economic development and regeneration. It should also address barriers to investment, allocate sites to meet identified needs over the plan period, paying particular regard to the needs of a modern economy (including sites and premises which are flexible and adaptable) and the specific locational requirements of different sectors. This includes making provision for:
The Government’s ‘The Ten Point Plan for a Green Industrial Revolution’ was published in 2020. It set out how the UK would recover from the impacts of the Covid pandemic, specifically leading on green technologies to transform the economy, deliver jobs and growth whilst taking account of climate change. This has subsequently been updated by the Government’s Net Zero Strategy and the consultation Invest 2035. The Net Zero Strategy sets out policies and proposals for decarbonising all sectors of the UK economy to meet the net zero target by 2050. Invest 2035 identified 8 growth-driving sectors identified: advanced manufacturing, clean energy industries, creative industries, defence, digital and technologies, financial services, life sciences and professional and business services.
The UK’s Modern Industrial Strategy (November 2025) supports the 8 growth driving sectors above, targeting places and clusters across the UK that support those sectors, to increase national productivity, strengthen economic security and resilience, and support environmental goals and the net zero transition. The Industrial Strategy Zones Action Plan (June 2025) aims to drive growth in the highest potential industrial clusters across our growth-driving sectors and the country. CW&C is not identified as a Industrial Strategy Zone but is located close to the industrial strategy zones of Liverpool City Region Innovation Zone (Advanced Manufacturing, Clean Energy Industries, Life Sciences), Wrexham and Flintshire Investment Zone (Advanced Manufacturing).
The Cheshire West and Chester Combined Authority has been established and will work with Council leaders, businesses and partners across the region, responsible for key areas including (i) transport and connectivity, (ii) skills and employment and (iii) investment and economic growth. A Spatial Development Strategy for Cheshire and Warrington will be developed in the future to coordinate growth, infrastructure, housing and employment across the region. Key investment opportunities are identified in Origin Ellesmere Port and the Cheshire Science Corridor.
The Cheshire and Warrington Combined Authority Shadow Board has approved a Cheshire and Warrington Sustainable and Inclusive Economic Strategy (2026-2045). The vision is to be the healthiest, most sustainable, inclusive and fast-growing place in the UK by 2045. Ambitions for the sub region include unlocking growth from industrial decarbonisation, supporting other significant sectors such as manufacturing, business and finance, logistics and distribution, digital technology and rural economy.
The Cheshire West and Chester Inclusive Economy Strategy seeks to build: a more productive economy, a more resilient economy and a more inclusive economy.
Cheshire West and Chester Regeneration plans include the Origin Ellesmere Port Investment Prospectus, the Chester One City Plan and The Mid Cheshire Plan (2025).
The CW&C Climate Emergency Response Plan 2025-2030 is developed to influence action to reduce greenhouse gas emissions throughout the borough, and to shape how the area adapts to the impacts of climate change that affect our communities. The relevance to the Economy Topic is to provide low carbon energy, reduce the need to travel, provide a resilient outdoor recreation and visitor resource, agricultural land and food production (rural economy).
The Council maintains a suite of economic data through the ‘State of the Borough Dashboard’ including business and economy, culture and tourism and skills and employment data: Business and economy | Cheshire West and Chester Council. The Council’s Annual Monitoring Reports (AMR) provide Local Plan monitoring data on new developments in the borough since 2010, together with contextual economic indicators. The text below summarises the key baseline information relevant to the preparation of the new Local Plan.
General employment data
The Cheshire West and Chester Unemployment rate for January 2025-December 2025 was 3.20%. This is below the national average of 4.50% during that period.
In December 2025 the number of the borough residents in employment was 81.2% and remains higher than both the national and regional levels of employment. The borough also has a skilled workforce with data showing that 52.9% of the population are qualified to degree level and above (RQF 4+). CW&C levels remain higher than regional and national averages with the percentage of people with no qualifications also being below regional and national levels.
Whilst earnings rose in 2025, the gap between residents and workplace earnings grew. Cheshire West and Chester’s average weekly wage for residents was £798.40 per week. Workforce earning within Cheshire West and Chester increased to £729.70 per week. There remains a gap in earnings of £68.70 per week between resident’s average weekly wage and the average workplace wage for those who work in the borough.
The number of businesses in CW&C in 2024 was 13,590. Since 2019 there has been a decrease in the number of businesses in the borough. Business number fell from 14,270 in 2019 to 13,590 in 2024. CW&C saw 1,450 new businesses register in 2024 and 1,315 businesses ceasing trading during the same period.
The Council's Annual Monitoring Report’s provide information employment land provision, take up and losses over the current local plan period and the development of key employment sites identified in Local Plan (Part One). Employment uses include offices, research and development, light industrial, general industrial and warehousing/distribution. It may also include specialist employment uses (for example, linked to energy or waste developments).
The Council’s Economic Needs Assessment (2025) has reviewed past trends in the take up and delivery of employment land / floorspace and makes recommendations for the new Local Plan.
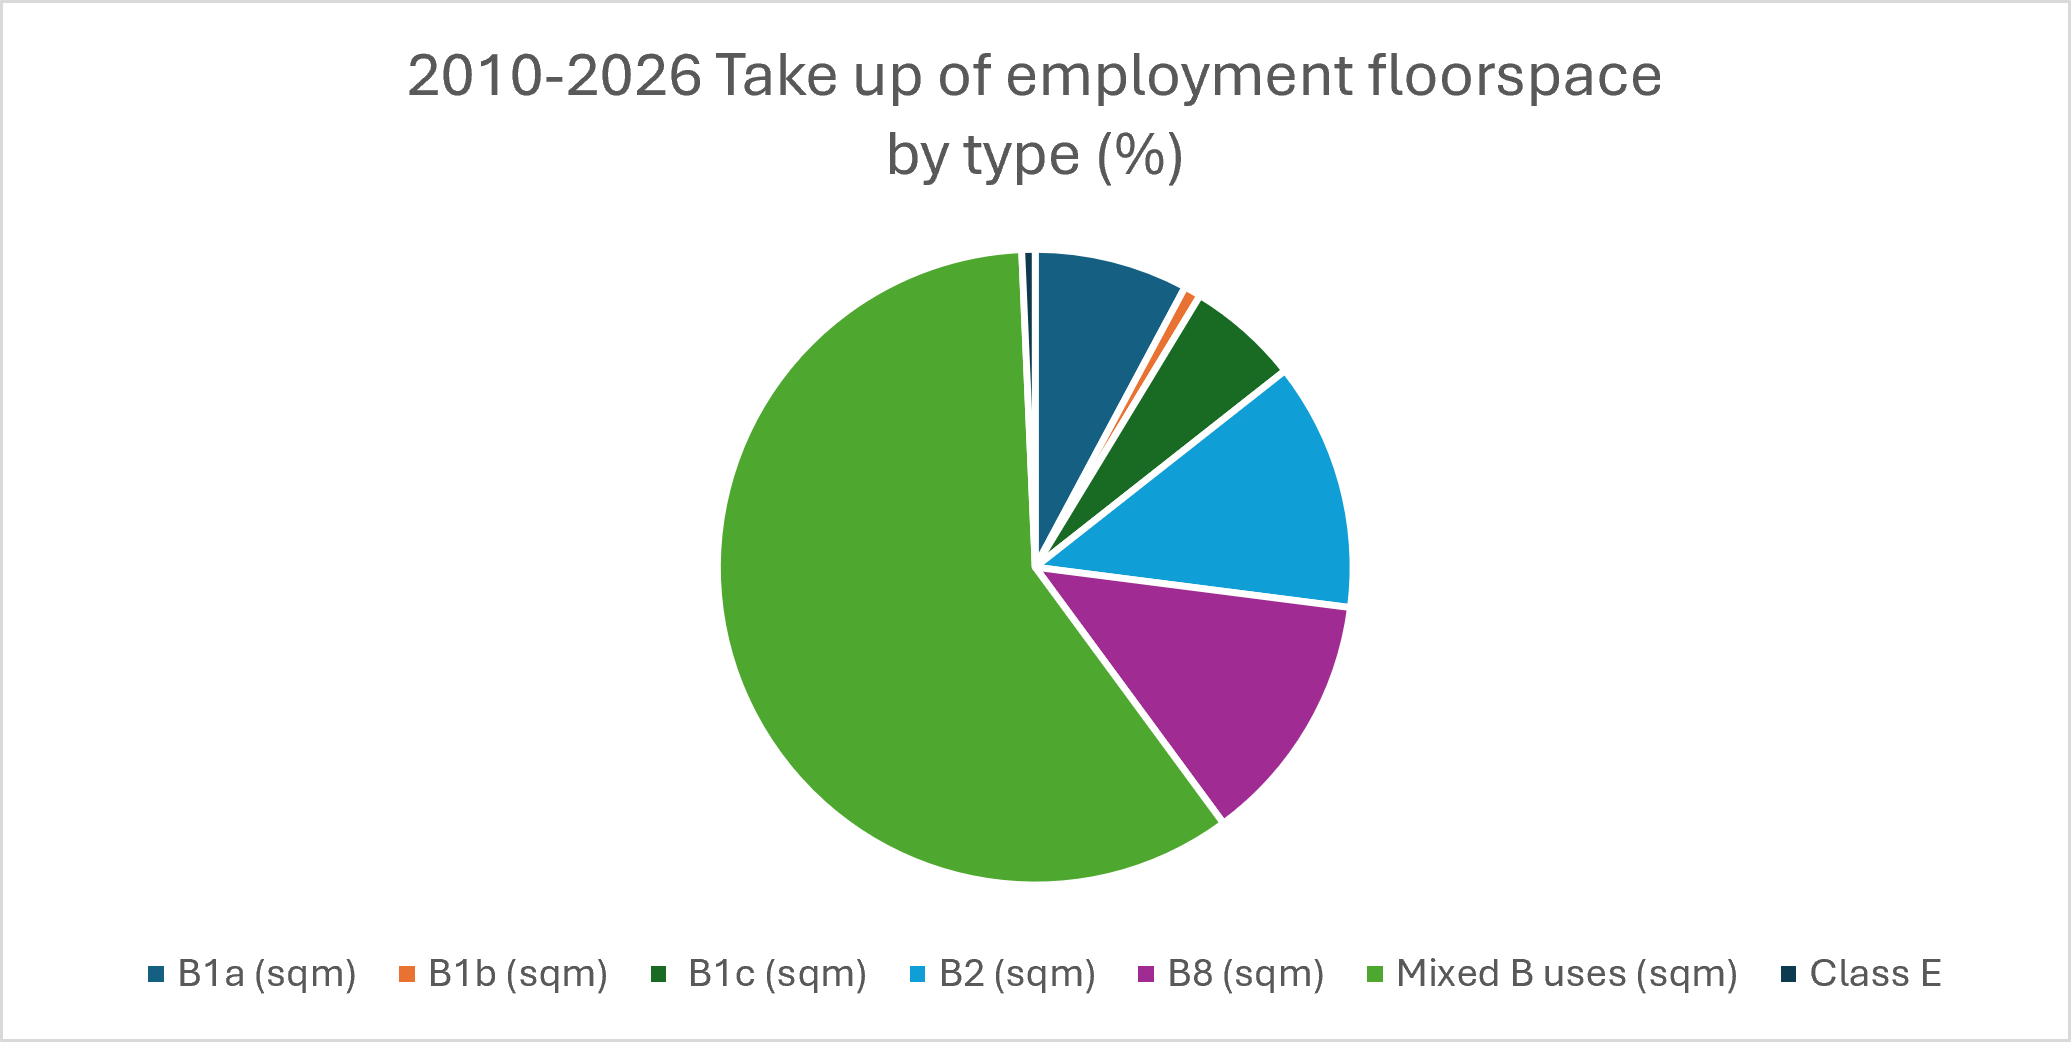
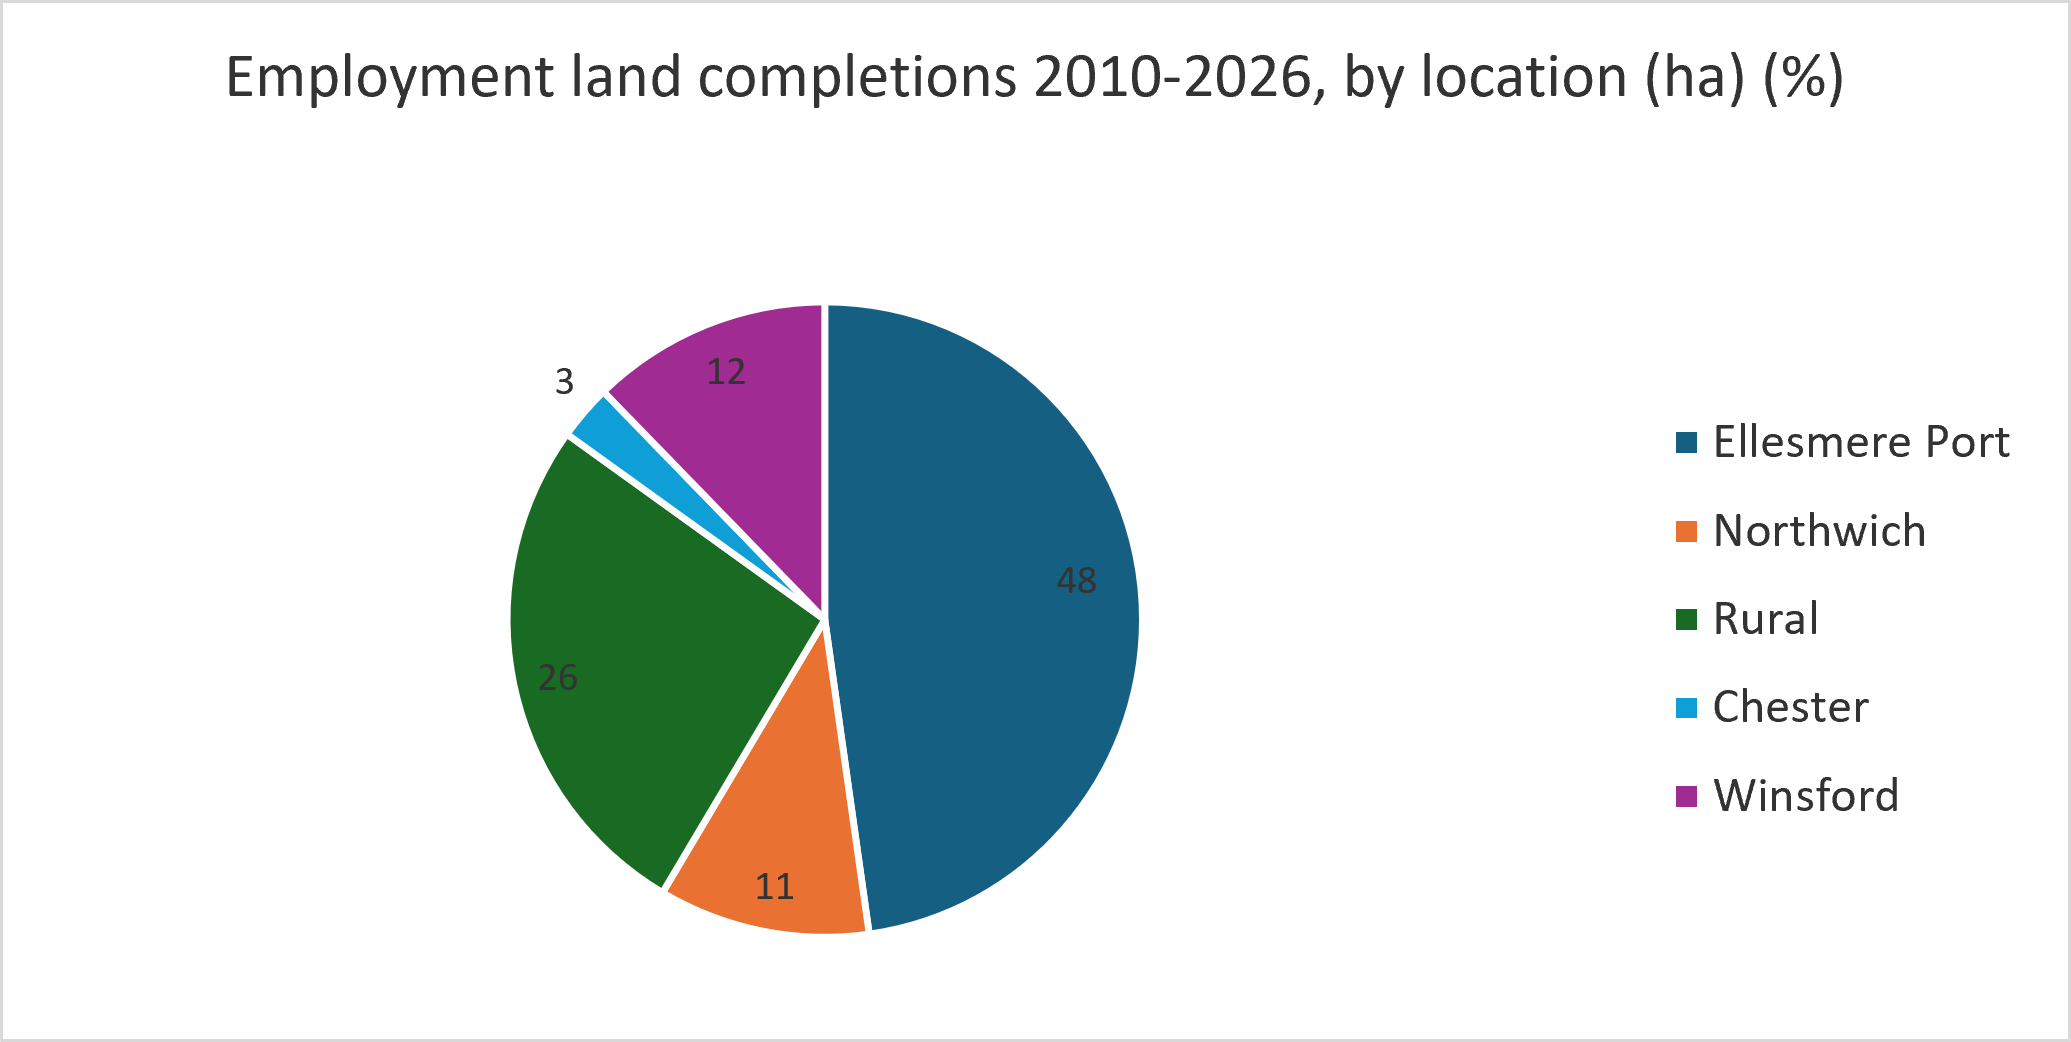
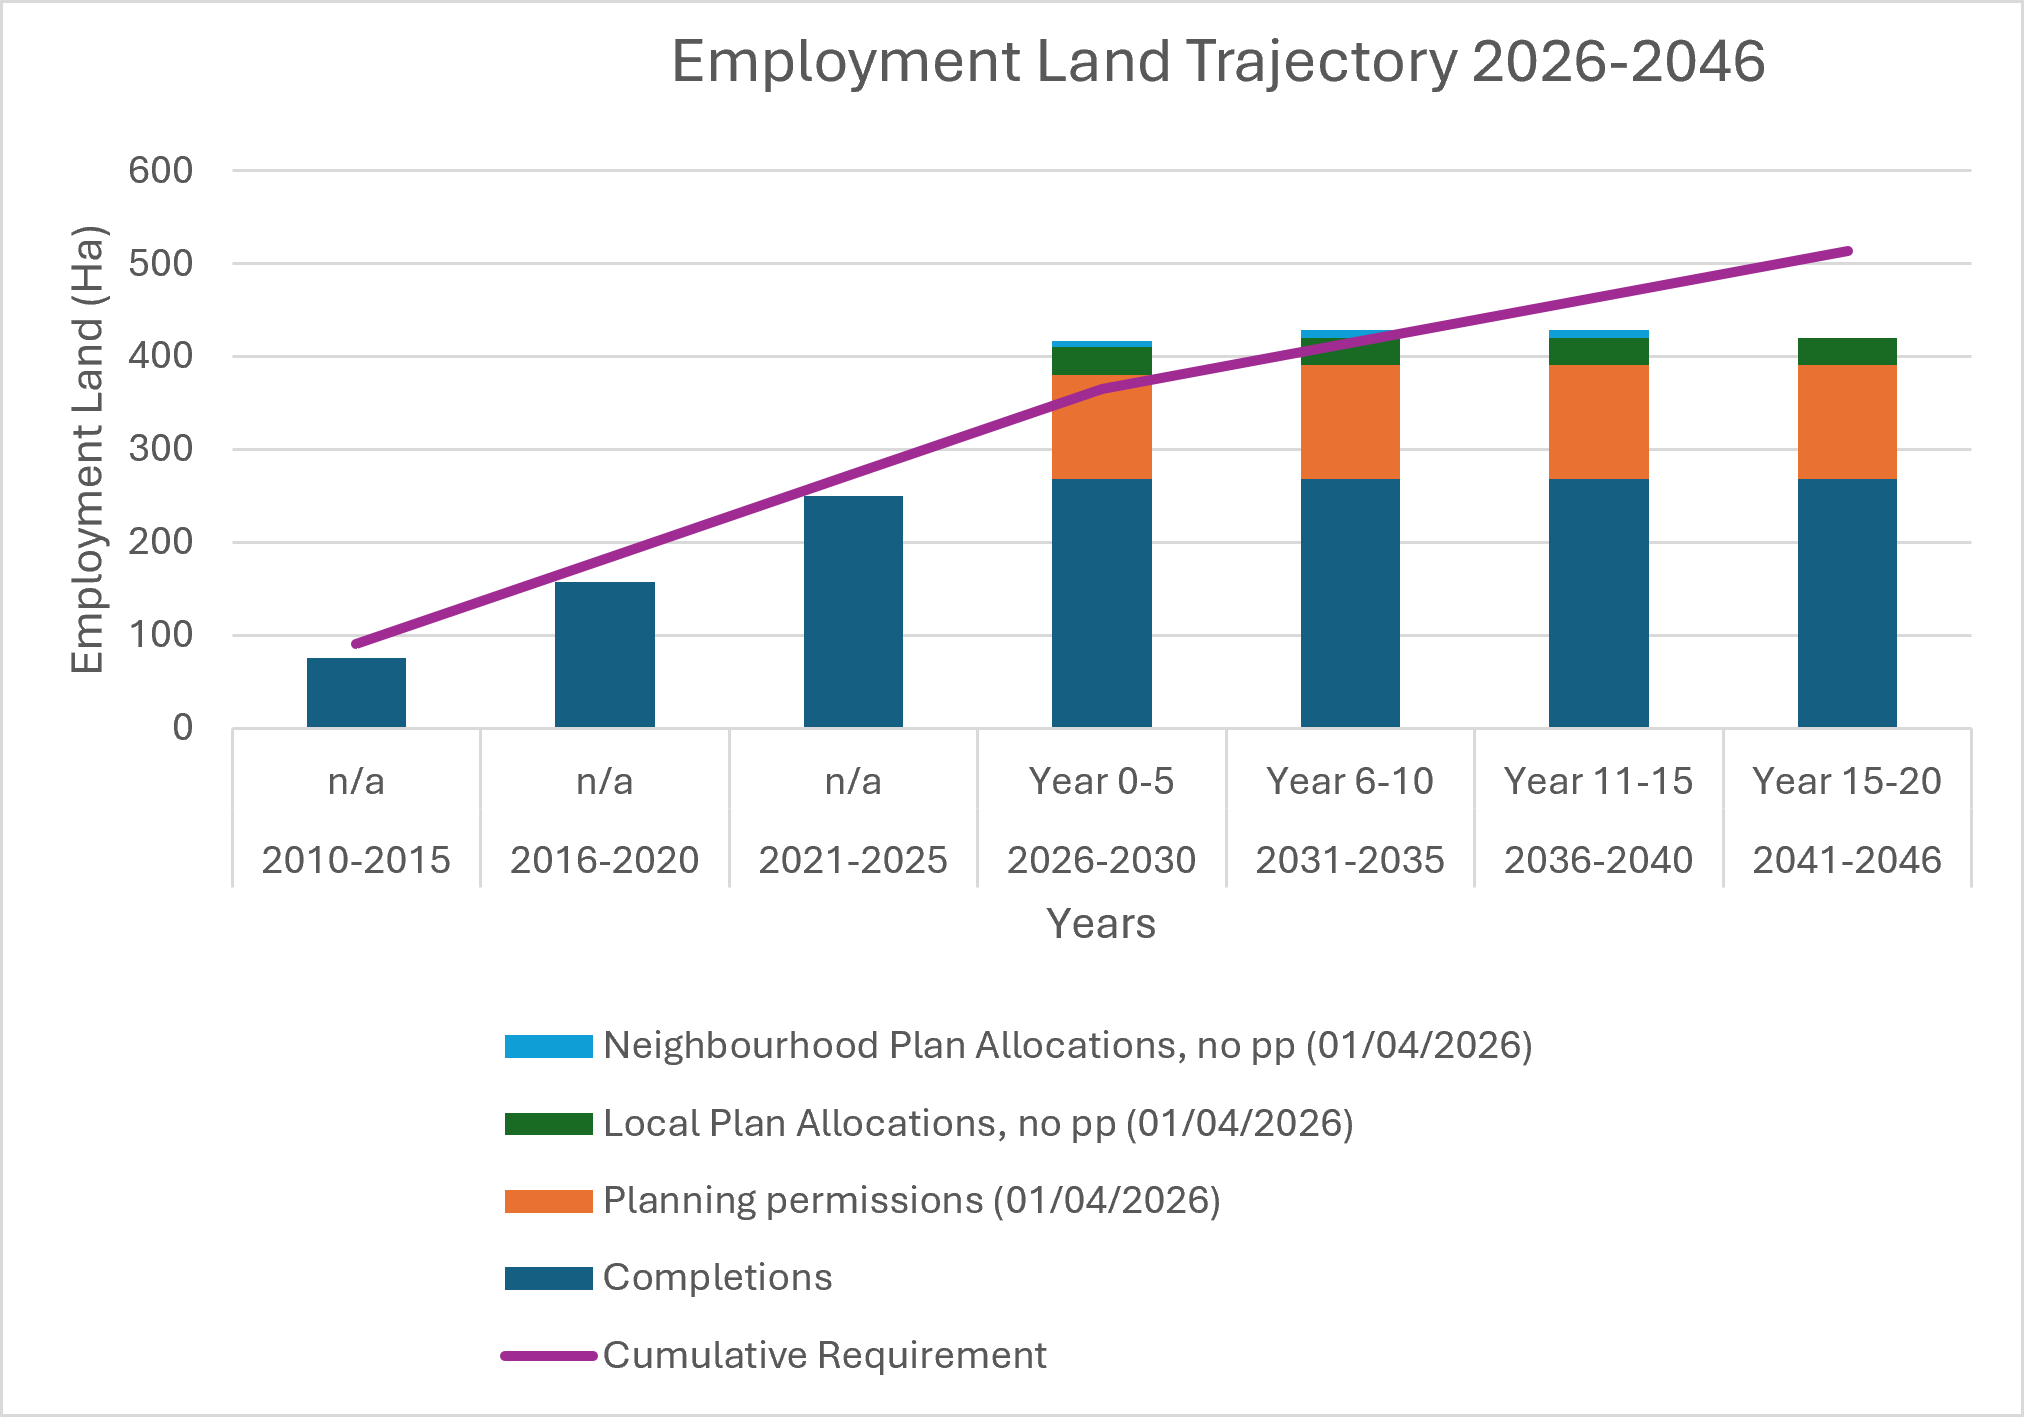
The cumulative amount of employment land developed (ha) over the adopted Local Plan period 2010-2030, at 1 April 2026 is 268.55ha. This is on target to meet the Plan requirement of 365ha over this period. The take up of employment land has varied by type and location as shown in Figure 11.1 and Figure 11.2 below.
The AMR considers future employment land supply. Adopted local plan allocations will be reviewed to ensure there is a reasonable prospect of development. Additional sites will be assessed, and it may be necessary to review and/or replace some allocations to meet future needs. Figure 11.3 below shows the potential employment trajectory 2026-2046 based on monitoring data at 1 April 2026.
The Councils Economic Needs Assessment (2025) provides a sectoral economic profile for the borough based on ONS data (Table 4.1 Employment Jobs by Sector). The largest sectors of employment in the borough are:
There are concentrations of particular industrial groups in the borough, where CW&C has a higher proportion of industries when compared to the North West of England and England figures. These include mining and quarrying; financial services and insurance; and accommodation and food. There are other sector strengths in a range of manufacturing industries including petrol refinement, glass products, communication equipment and chemicals.
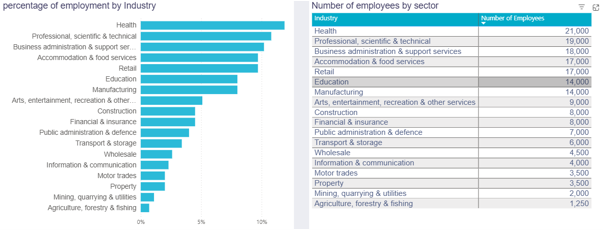
The NOMIS Business Register and Employment Survey API provide information on sectors of the boroughs economy. This is shown in the graph below. The sectors with the highest number of employees in CW&C at 2024 are health (21,000); professional, scientific and technical (19,000); business administration and support services (18,000); accommodation and food services (17,000) and retail (17,000).
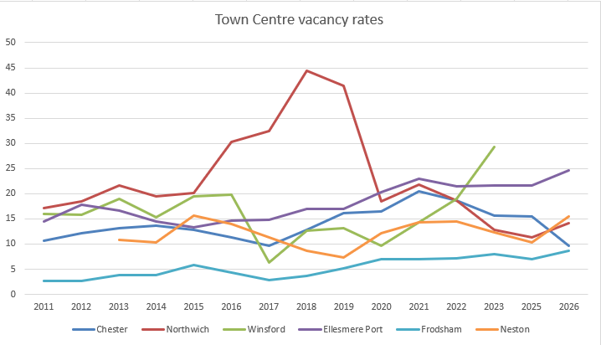
Vacancy rates can provide an indication of the overall health of the borough’s town centres. Within the six town centres, only Chester has decreased its vacancy rate in 2026 compared with 2025. The other five (Northwich, Winsford, Ellesmere Port, Frodsham and Neston) have marginally increased their vacancy. Winsford currently has the highest vacancy rate overall (27.6%) and Frodsham has the lowest (8.7%). The peak in Northwich from 2017-2020 can be linked to the completion of the new Baron’s Quay development and the regeneration of the Weaver Square area.
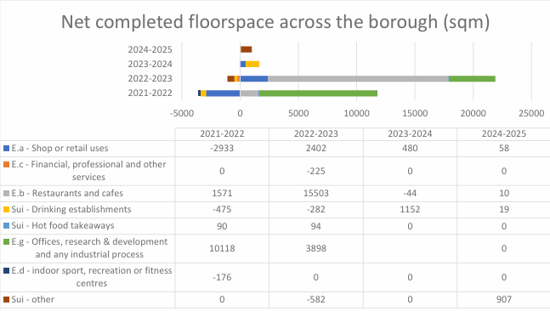
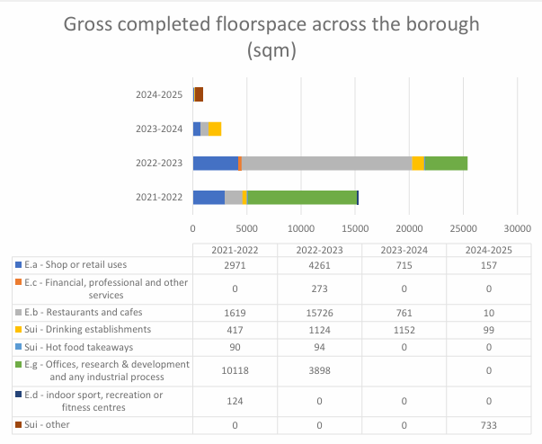
The Council’s Annual Monitoring Report (AMR) contains details of the amount of new floorspace developed within town centres for main town centre uses, in line with the aims of Local Plan policy over the plan period. It also monitors the overall development of floorspace for main town centre use across the borough. The two graphs below show the trend of net completed floorspace across the borough and gross completed floorspace across the borough.
Tourism and culture are an important part of the borough’s economy. In 2024 there were 30.6 million visitors to the borough. This was an increase from 29.2 million visitors in 2023, the majority of these are day visitors (28.8 million). Figures state that total employment supported by visitors (FTE) is 22,441 in 2024. The borough has some large visitor attractions such as Chester Zoo, it provides heritage-based tourism including Beeston Castle and historic settlements. The borough also provides for major sporting events such as Chester Races and Oulton Park racecourse. Staying visitors were 1.7 million in 2024. There has been a slight increase year on year since 2020 for staying visitors in the borough with trends looking like they will eventually return to former levels pre-pandemic.
The 2021 Census results provide data on labour market and travel to work data. The Census 2021 took place during the coronavirus (COVID-19) pandemic, a period of unparalleled and rapid change; the national lockdown, associated guidance and furlough measures which will have affected the travel to work topic. ONS advises care should be taken when using this for planning and policy purposes. In Cheshire West and Chester 31.5% of people worked mainly from home. The distances travelled 20-30km and 30-40km, were slightly higher than the national percentages (with other distances comparable to national rates). Further analysis of the travel to work data would be useful for smaller geographical areas within the borough.
Travel to work areas have been considered in the Economic Needs Assessment (2025) to inform assessment of the Functional Economic Market Area (FEMA). In total the 2021 Census states that there are 169,090 residents in employment in Cheshire West and Chester. Of these, 132,381 work in Cheshire West and Chester (including those working from home). This is the equivalent of a residents-based self-containment rate of 78.3%. This exceeds the 75% threshold used by ONS to define Travel to Work areas. This, alongside other indicators, suggests that the Cheshire West and Chester FEMA is self-contained. However, it is important to consider the sub-areas of the borough and differences between the east and west. Northwich and Winsford have less reliance on Chester in terms of commuting.
The CW&C Economic Development Needs Assessment (EDNA) 2025 reviews the impact of recent trends and future employment land needs. It considers future employment needs borough wide and by employment type/sector, location and size.
Demand for office or light industry falling within (planning use class E) has been impacted by the Covid-19 pandemic, with a shift towards homeworking. Given changes to the office market, it is likely that some vacant buildings will be under pressure for re-use or redevelopment to alternative uses. Employers/developers may explore other ways that vacant employment buildings can be used more effectively, particularly poorer quality premises where commercial viability is a concern.
Demand for industrial, warehousing, distribution (planning use classes B2, B8) continues and the EDNA suggests this will be the majority of future employment requirements. The borough has some major employers in manufacturing and other specialist industries; industrial decarbonisation from some of these larger industries is likely to be important. There are emerging proposals linked to hydrogen (HyNet) particularly in the Ellesmere Port and Northwich areas. The EDNA indicates that Ellesmere Port followed by Northwich and Winsford are the priority areas for employment land provision, with office demand focussed around Chester. Site size is important, with sites of over 5ha being most capable of attracting new inward investment. The need for expansion land for specific employers is expected to continue.
The Council's employment land monitoring/AMR data includes data on employment land completions by type and location. The previous graph shows the trends for the cumulative take up of employment floorspace (B2, B8 and former B1 use classes) as at April 2026. Most land developed has been flexible for mixed employment uses, with high levels of floorspace also developed for B2 and B8 uses. Office development in the borough has been at lower levels. It is anticipated that the trend for employment land for B2/B8 uses is likely to continue.
In September 2020, the Government amended the Use Classes Order to introduce a new Class E. This provides greater flexibility for different uses falling within Class E, to change without the need for planning permission (for example, an office to a shop). The intention was to support city/town centres and high streets to reflect changing requirements. However, the legislation is not limited to specific areas and applies equally to purpose built Business Parks for offices and out of town retail areas, unless these are controlled through measures such as legal agreement or conditions or through the introduction of Article 4 Directions. The likely trend is that a wider range of uses are likely to appear on High Streets and flagship office Business Parks, or smaller scale changes to offices/retail in rural areas may occur.
The Retail Study (March 2025) concluded there is no quantitative need for additional convenience (food) or comparison (non-food) retail floorspace up to 2040, even under a higher population growth scenario.
The study suggests Cheshire West and Chester already has more retail floorspace than is likely to be needed, meaning some units may become vacant or require alternative uses over time. Therefore, the focus should be on reusing and repurposing existing premises.
Chester is still the dominate centre where higher order retail and leisure investment should be directed. The town centres will need to diversify in order to maintain vitality. The study highlights the importance of:
The future success of centres will depend on creating experiences that encourage people to visit rather than shop exclusively online.
The study recommends:
The Government’s national PPG provides guidance on Housing and Economic Needs Assessments and Housing and Economic Land Availability Assessments to provide evidence for plan making.
The Cheshire West and Chester Economic Development Needs Assessment was completed in 2025 and provides recommendations for the new Local Plan. Further updates to this may be required in due course.
The Housing and Economic Land Availability Assessment will now be taken forward as part of the site selection process for the Local Plan, in line with updated national guidance. The Local Plan should identify strategic sites for local and inward investment and further site-specific work may be required alongside an Infrastructure Delivery Plan and other supporting evidence.
The new Local Plan will provide a policy framework for sustainable economic growth in the borough. It can consider future economic growth requirements, the land use requirements for new investment, to allow for business growth or expansion, by employment type and location in the borough.
The Local Plan can allocate employment land to meet the future identified needs over the new plan period and identify broad locations for new economic development. It can contain policies and land allocations to support the boroughs town and local centres, and promote economic regeneration within key areas. It could also safeguard key employment locations for continued employment use.
| Sustainability objective | Appraisal criteria / sub-objective | Baseline indicator |
|---|---|---|
| Support a sustainable, resilient and inclusive economy and provide opportunities for economic growth and investment | Will it help create the conditions in which businesses can invest, expand and adapt? |
Employment land completions, by type and location (STRAT 2 (F)) Cumulative employment land completions by type and location (AMR) (STRAT 2E)) Employment land supply and distribution, by type and location (STRAT2(F)) Employment land loss, by type and location Employment by broad industrial sector Enterprise births and deaths (ECON 1 (Ci)) Number of businesses (ECON 1 (c)) Number of visitors to the borough (STEAM data on visitor economy) Number of day and overnight visitors to the borough (ECON 3 (Ai)) Number of borough residents in employment (ECON 1) Unemployment rate (ECON 1 (B) Number of businesses (ECON 1 (C)) (The same indicators for all appraisal criteria / sub-objectives) |
| Will it support sustainable economic growth? | ||
| Will it provide a balanced portfolio of employment land for the area by type and location? | ||
| Will it maintain/safeguard high quality employment land and premises? | ||
| Will it contribute to meeting the employment needs of the rural/urban area? | ||
| Will it promote tourism and the visitor economy? | ||
| Will it improve accessibility to jobs? | ||
| Will it take account of the different locational requirements of different sectors? | ||
| Promote regeneration, particularly of deprived areas and reduce inequalities | Will it deliver regeneration? | No indicator identified |
| Will it improve economic conditions, particularly in deprived areas? | Number of LSOA in 20% most deprived in the borough | |
| Will it improve equality across the borough? | Number of households in fuel poverty | |
| Local Authority ranking in the social mobility index |